The Hidden Sound of Climate Change: Why Our Cooling Systems are Getting Louder
When we talk about the impacts of climate change, the conversation naturally gravitates toward rising temperatures, extreme weather, and shifting ecosystems. But there is another, far less discussed side effect of a warming world: it is getting significantly louder.
As global temperatures and humidity levels rise, our reliance on air conditioning and heavy refrigeration systems is skyrocketing. To see this in action, we only need to look at a recent noise monitoring project we were commissioned to undertake.
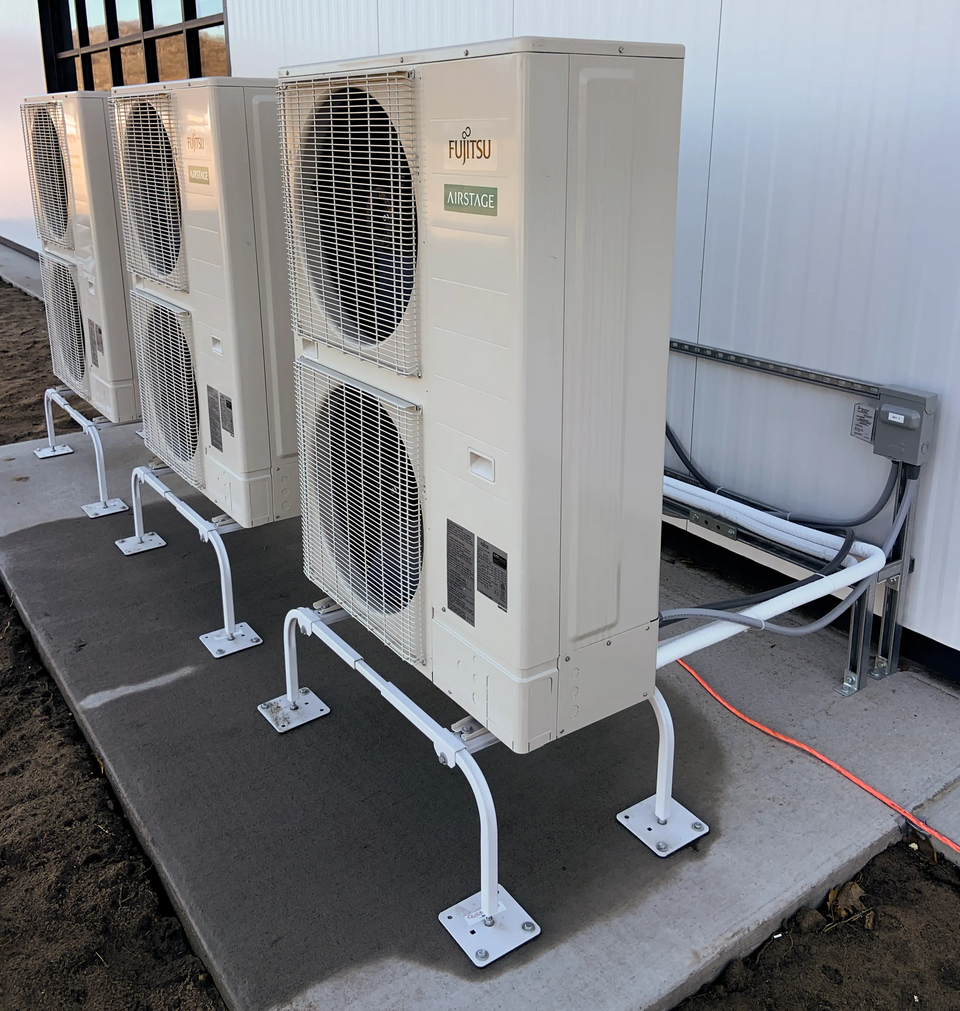
Large AC Unit
The Case Study: A Large Sports Facility in Wimbledon
We were recently called in to assist a local residents’ group living in the shadow of a large, well-known sports facility in Wimbledon. Their complaint is becoming increasingly common in urban and suburban areas: the mechanical hum of the facility’s air conditioning and refrigeration units has become unbearable.
The worst of the noise pollution seems to occur during major events, particularly when the stadium’s roof is closed, forcing the environmental control systems to work at maximum capacity to keep spectators comfortable. Even more frustrating for the locals is that these cooling systems are now occasionally running well past their standard 11 PM curfew.
To investigate, our team is deploying remote noise monitors in the back gardens of affected homes to capture real-world data over a couple of weeks. By comparing these live running noise levels against the facility’s original baseline noise report and planning permission limits, we can determine exactly how much the acoustic environment has degraded.
Why is the Noise Getting Worse?
According to the residents, when this cooling equipment was first installed roughly 10 to 15 years ago, the noise was noticeable but manageable. Today, it feels constant. While aging equipment and routine maintenance factors certainly play a role, the changing climate is the primary driver.
Here is exactly how shifting weather patterns are turning up the volume on local infrastructure:
-
Hotter, More Humid Days: Anecdotally (though supported by meteorological trends), the nature of our summer heat is changing. We aren’t just seeing higher peak temperatures; we are experiencing intense, sticky humidity that we haven’t historically dealt with in the UK. Cooling systems have to work much harder to strip moisture from the air, meaning fans and compressors are running at full tilt more consistently than they were designed to a decade ago.
-
Warmer Nights: The residents noted that the AC systems are running much later into the night. Because overnight temperatures are failing to drop to historical averages, facilities can no longer rely on natural nighttime cooling. Mechanical systems are forced to bridge the gap, running deep into the night and breaching traditional noise curfews.
-
The “Greenhouse” Effect of Enclosed Stadiums: When facilities close their roofs to protect events from unpredictable weather, they inadvertently trap heat and humidity. Blasting the AC to compensate creates an acoustic double-whammy: the systems work harder, and the noise generated is often pushed outwards toward the surrounding neighborhoods.
The Acoustic Reality: We are currently relying on mechanical infrastructure designed for the climate of 2010 to handle the extreme weather of today. The result is overworked machinery, higher energy consumption, and a lot more noise.
Planning for a Louder Future
This project in Wimbledon highlights a growing challenge for environmental acoustic consultants, urban planners, and local councils.
When large commercial facilities conduct their initial noise impact assessments, the baselines are calculated using historical climate data. If a system only needed to run at 50% capacity for a few weeks a year when it was installed, its acoustic footprint was likely deemed acceptable. But when that same system is forced to run at 90% capacity for months on end—and late into the night—those original noise limits are easily shattered.
As we continue to adapt to hotter summers, we must ensure that our noise regulations and equipment standards adapt alongside them. Otherwise, we risk trading the discomfort of the heat for the exhaustion of sleepless, noisy nights.
Here is an additional section you can slot right into the blog post, perhaps just before the concluding “Planning for a Louder Future” section:
The Crucial Role of the “+5 Decibel” Planning Condition
When investigating noise complaints like the one in Wimbledon, our primary point of reference is the facility’s original planning permission. One of the most important tools local councils use to protect residential amenity is a specific noise condition—often stipulating that the noise from mechanical plant (like AC and refrigeration units) must not exceed the existing background noise level by more than a set amount, typically 5 decibels (5 dB).
Here is why this specific condition is so critical, especially in a warming world:
-
It Relies on Context, Not Just Volume: Background noise drops significantly at night when traffic dies down and people go to sleep. A cooling unit that blends into the daytime hum of a city can sound like a jet engine at 11 PM. By tying the noise limit to the background level rather than a fixed number, the condition ensures that the acoustic character of the neighborhood is protected during its quietest, most vulnerable hours.
-
The “Noticeability” Threshold: In acoustics, an increase of 5 dB is generally the point where a new noise becomes clearly noticeable and potentially intrusive to the human ear. If AC units were allowed to operate unchecked without this cap, creeping noise pollution would slowly erode the quality of life for nearby residents, leading to stress, sleep deprivation, and a loss of enjoyment of their own homes.
-
A Measurable Line in the Sand: As climate change forces older AC systems to work harder and run later into the night, facilities can easily stray from their original operating parameters. The 5 dB limit provides an objective, measurable threshold. When residents complain that the noise has “gotten worse,” acoustic consultants can place a monitor in their garden, capture the real-time data, and definitively prove whether the facility is breaching its legal planning limits.
Ultimately, this standard prevents facilities from passing the environmental cost of their cooling needs onto their neighbors. As our summers get hotter, enforcing these strict background-relative limits will be our best defense against the creeping roar of urban infrastructure.
If you have a problem with Noise from Air Conditioning Units then Please contact us.