Nepal Floods 2026 – What Next?
The recent catastrophic flooding in Nepal has offered a devastating, visceral reminder of nature’s raw power. Watching mature trees flung like matchsticks and civil infrastructure—including entire dams—annihilated by walls of hyper-concentrated debris leaves an indelible mark.
My thoughts are deeply with the residents of the recently affected regions, including the Thame Valley (following the devastating August 2024 Glacial Lake Outburst Flood from the Ngole Cho lakes), the Melamchi Valley (2021), and the Trisuli gorge (August 2026). These communities have endured unimaginable loss, yet their resilience in the face of such profound geological and climatic upheaval is profound.
When observing material moving at 100 mph (approx. 45 m/s) with a density of 1.8 tons/m³, it is entirely natural to ask: Is there any engineering design response to this level of force?
I should note that for this post I have used Gemini AI to augment my own thoughts and as such the wording may come across as rather gushy, which I do not think very fitting given the circumstances, but I thought better to get these thoughts out in the either, and I would be able to do that without the use of AI.
To answer this, we must deconstruct the mechanics of these floods, rethink our spatial relationship with riverbank settlements, and examine how Nepal is already pioneering early warning systems to adapt to an increasingly unpredictable climate. This article explores the physics of glacial lake outburst floods (GLOFs), the necessary evolution of mountain urban planning, the critical role of civic early warning systems & training, and the advanced hydrological modeling required to face the temporary but severe threat of melting Himalayan glaciers.
Chapter 1: The Physics of Annihilation – Hydrodynamic Loading vs. Structural Design
When we speak of standard river flooding, we are usually discussing clear-water flows. The recent events in Nepal, however, transitioned into hyper-concentrated flows or debris flows. In these events, the fluid is not just water; it is a slurry of pulverized rock, glacial till, mud, and organic matter.
Let us calculate the dynamic impact pressure this exerts on a structure, such as a dam or a bridge abutment.
The dynamic pressure (Pd) exerted by a flowing fluid is calculated using the formula:
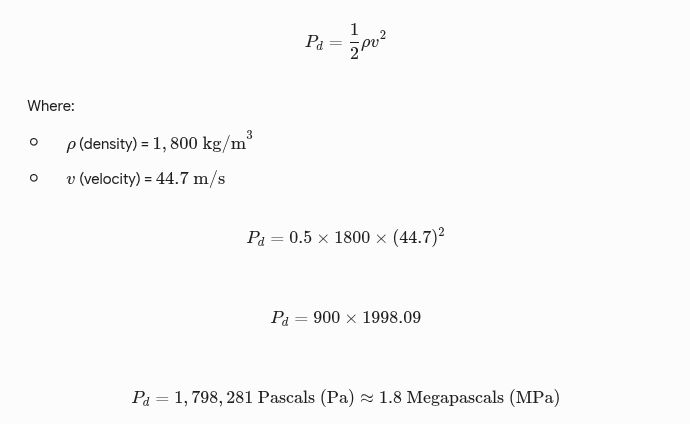
To put 1.8 MPa into perspective: this is equivalent to 180 tons of force per square meter.
When calculating the total impact force (F impact) on a solid structure, engineers apply a drag coefficient or impact factor (Cd), which for debris flows can range from 1.5 to 5 due to the impact of massive boulders (solid-particle collision). Even at a conservative impact factor of 2, the localized pressure leaps to 3.6 MPa (360 tons of force per square meter).
How does this compare to typical dam design?
Most standard hydroelectric dams and retaining walls in mountain river networks are designed primarily to withstand hydrostatic pressure (the weight of still water) and standard flood dynamic loads. For a 10-meter-high dam, the hydrostatic pressure at the base is roughly 0.1 MPa (10 tons per square meter). Even accounting for safety factors and 100-year flood clear-water overtopping, the design load might peak at 0.3 to 0.5 MPa.
A hyper-concentrated debris flow hitting at 1.8 to 3.6 MPa exceeds typical structural design thresholds by an order of magnitude (5x to 10x). This is exactly why the dam in the footage you saw was annihilated. Concrete simply shears, and reinforcing steel snaps under such blunt kinetic trauma.
The Engineering Response:
Is there a design response to this? Yes, but it is not “building stronger walls in the river.” The engineering response must shift from resistance to deflection and energy dissipation.
-
Sacrificial Bumper Structures: Constructing heavily reinforced, V-shaped concrete or gabion deflectors upstream of critical infrastructure designed specifically to shatter and absorb the kinetic energy of boulder impacts.
-
Bypass Channels & Overtopping Designs: Modern run-of-the-river hydro projects must be designed to be safely overtopped or bypassed by debris, rather than trying to hold back the volume.
-
Retreat: The most realistic engineering response is acknowledging that no cost-effective structure can withstand 1.8 MPa of continuous debris flow. Critical infrastructure must be elevated well above the historically modeled maximum flood stage.
The True Violence of Point Loading
While a distributed load of 3.6 MPa (360 tons/m²) is catastrophic, it still underestimates the true violence of a debris flow. The flow does not arrive as a steady pressure; it travels in violent, pulsing surges—or “roll waves”—that repeatedly shock a structure. Furthermore, generalized pressure fails to capture the devastating reality of point loading. If a car-sized boulder weighing 10,000 kg, traveling at 100 mph (45 m/s), slams into a concrete abutment, it transfers roughly 10 million joules of kinetic energy in milliseconds. This singular, localized impact creates a concentrated shear force that instantly shatters reinforced steel and concrete, demonstrating why standard distributed-load calculations often fail against blunt-force geological trauma.
Chapter 2: Redefining Urban Planning: The Escape Geometry of Mountain Towns
Your observation regarding escape routes is deeply perceptive and identifies a fatal flaw in how many riverine settlements organically develop. In the steep valleys of the Himalayas, flat land is a premium. Consequently, towns often develop linearly, hugging the riverbank. Streets run parallel to the water, bordered by continuous, unbroken facades of houses and shops.
When a sudden GLOF or debris flow occurs, the floodwaters breach the banks laterally. Residents intuitively flee away from the rising water, but they are met with a solid wall of buildings. Forced into the streets, they must run parallel to the river to find an opening to higher ground. You cannot outrun a 100-mph flow laterally.
The Solution: Perpendicular Gaps and Vertical Evacuation
Urban planning in high-risk mountain valleys must enforce “escape geometries.”
-
Mandatory Facade Gaps: There must be enforced breaks in continuous building blocks along riverbanks. Just as fire codes require emergency exits, flood-prone towns require spatial breaks every 20 to 30 meters.
-
Upslope Corridors (The 90-Degree Escape): These gaps must connect directly to steep, well-maintained stone steps leading 90 degrees away from the river and directly up the valley wall.
-
Integration with Local Architecture: Nepal already has a rich heritage of terrace building and stone stairways (like those seen on the trekking routes of the Khumbu or Annapurna regions). Urban planning does not need to impose foreign concrete structures; it simply needs to mandate that traditional stepped pathways are integrated into modern riverside commercial zoning.
By formalizing these escape gaps, a person only needs to sprint 10 to 20 meters laterally to reach a staircase, rather than running 500 meters down a parallel street while the water accelerates behind them.
Chapter 3: Civic Implementation and Early Warning Systems
Structural gaps only work if people have the time to reach them. A GLOF traveling at 45 m/s covers 2.7 kilometers every minute. If the glacial lake is 15 kilometers upstream, the village has less than 6 minutes from the moment of breach to absolute devastation.
You mentioned emergency text alerts, asking if a system like “Larma” (alarms) or emergency SMS is in place. The inspiring news is that Nepal is already a global leader in implementing life-saving mass SMS alert systems.
Through the Department of Hydrology and Meteorology (DHM) and the National Disaster Risk Reduction and Management Authority (NDRRMA), Nepal utilizes a Multi-Hazard Early Warning System (MHEWS). In recent flood events—such as the massive August 2026 Trisuli gorge flood—the system proved its immense worth. When upstream observers and automated gauges detected abnormal, rapid water rises, the DHM triggered an alert.
Within a single minute, nearly 680,000 localized warning text messages were blasted to mobile phones via Nepal Telecom and Ncell to users in the flood’s path. This cell-broadcast/mass SMS system bypasses network congestion and triggers localized alarms. In one instance, a school principal received the text and evacuated over 1,600 students to higher ground just before a debris flow wiped out the valley floor.
Areas for Civic Improvement:
While Nepal’s system is saving thousands of lives, the government and NGOs (like ICIMOD and UNDP) are continuously working to improve it:
-
Upstream Automated Sensors: Transitioning from downstream river gauges to automated trip-wires, acoustic sensors, and pressure transducers placed directly at the high-altitude glacial lakes (e.g., Imja Lake and Thulagi Lake) to provide those crucial extra minutes of warning.
-
Actionable Protocols: Ensuring that a “Code Red” SMS dictates a pre-agreed civic response. An alert is only useful if everyone knows exactly which upslope steps to run to without hesitation.
The Human Element: Panic, Psychology, and the “Vertical Sprint”
Designing spatial gaps and stone steps for a 90-degree escape is only half the engineering equation; the other half is human psychology. We must account for how human beings actually behave when profoundly terrified—because the acoustic and visual arrival of a 1.8 MPa wall of earth and water induces immediate cognitive overload.
Disaster psychology and evacuation studies consistently show that in the first crucial seconds of an extreme emergency, humans are rarely proactive. Instead, we become highly reactive. When a deafening roar echoes down a valley, the instinctive response is often to freeze, seek out authority figures for instructions, or simply copy what the crowd is doing. If the crowd is running parallel to the river in a panic, others will blindly follow, even if it is a fatal geometry. Furthermore, when terrified, people struggle to process complex new information; if they have to “figure out” their escape route while the ground is literally shaking, it is already too late.
Therefore, the “running uphill” concept is just as much a matter of civic education as it is urban planning. The instruction to “evacuate” cannot be an abstract concept; it must be a trained physical reflex. People living and working in high-risk zones should not have to decide where to go or what to leave behind when a disaster is unfolding.
This is where mandatory, community-wide evacuation drills become the most critical infrastructure of all. The goal of a drill is to build muscle memory, ensuring that when the terror sets in, the body knows to immediately execute a “vertical sprint” away from the riverbank without waiting for conscious thought to catch up.
Importantly, this is not a foreign concept to Nepal. Community Disaster Management Committees, often supported by the UN Food and Agriculture Organization (FAO) and the UN Development Programme (UNDP), already conduct community-based flood simulation exercises in various flood-prone districts. In the Dudh-Koshi basin, around the Imja Glacial Lake, early warning system installations were paired with community risk knowledge programs so that downstream villages understood exactly what the warning sirens meant.
The next evolution of this practice is integrating the architectural redesigns directly into these drills. When a localized SMS alert sounds—or a community siren wails—the drill must physically require residents and shopkeepers to practice sprinting through the designated urban gaps and up the perpendicular stairways. By marrying structural escape routes with the psychological conditioning of routine drills, communities can bypass the paralysis of fear and buy themselves the 10 to 20 seconds needed to survive.
Chapter 4: Hydrological Analysis & Catchment Modeling
To accurately predict the volume of water and debris that might be unleashed, civil engineers and hydrologists must look far upstream to the “ice catchments.” We cannot just design for what water is in the river today; we must design for the water stored as ice and trapped behind fragile moraines.
1. Topographic and Bathymetric Analysis of Ice Catchments
A GLOF occurs when a terminal moraine—a natural dam of loose rock and soil left behind by a retreating glacier—fails. To calculate the maximum volume potential:
-
Bathymetric Surveys: Using remote-controlled sonar boats to measure the depth and exact volume of glacial lakes (e.g., the recent assessments of the Upper and Lower Ngole Cho lakes that devastated Thame).
-
Moraine Stability Modeling: Geotechnical engineers model the shear strength of the moraine dam. Does it contain an ice core? If the ice core melts, the dam slumps and fails.
-
Displacement Wave Modeling: Often, lakes do not just burst on their own; an avalanche of rock or hanging ice falls into the lake, creating a massive displacement wave (a localized tsunami) that over-tops and erodes the moraine. Topographic analysis of the slopes above the lake is critical to predict avalanche trajectories.
2. Routing the “Worst-Case” Event
Once the maximum potential volume of meltwater is calculated (often millions of cubic meters), hydrologists use 2D hydrodynamic modeling software (like HEC-RAS or FLO-2D) to route the flood wave down the valley.
-
Geomorphic Channel Modification: A debris flow does not flow through the existing river channel; it remakes the channel. It scours the bed, eroding the banks and incorporating that mass into the flow (bulking). Models must account for dynamic bed elevation changes.
-
Calculating Water Levels: By simulating this massive volumetric influx ($100\text{s of m}^3/\text{sec}$), engineers generate inundation maps. These maps dictate exactly which streets are in the “red zone” and dictate where the aforementioned “escape gaps” must be placed.
Chapter 5: The Temporary Nature of Glacial Threats
As terrifying as these forces are, it is vital to contextualize them within the broader, tragic timeline of global climate change. These specific types of ultra-massive Glacial Lake Outburst Floods are a temporary, transitional hazard.
The glaciers of the Himalayas—the “Water Towers of Asia”—are dying.
According to landmark reports from the International Centre for Integrated Mountain Development (ICIMOD) released recently, glaciers in the Hindu Kush Himalaya lost roughly 12% of their total area between 1990 and 2020, and the rate of mass loss has doubled since 2000. For global warming pathways between 1.5°C and 2°C, these glaciers are projected to lose 30% to 50% of their volume by 2100. Under higher emission scenarios, up to 80% of glacial volume could be eradicated.
The “Peak Water” Phenomenon:
Currently, we are in the era of “Peak Water.” As the glaciers melt at an accelerated rate, they form thousands of new, unstable lakes. Over 200 lakes in the region are currently classified as ticking time bombs. This rapid melting phase is generating unprecedented downstream flow volumes and an explosion in GLOF frequency.
However, this threat has an expiration date. ICIMOD estimates that meltwater supply in the region will peak around mid-century (circa 2050). After the most vulnerable glaciers (particularly those under $0.5 \text{ km}^2$) vanish completely, the threat of catastrophic GLOFs will severely diminish because the source material—the ice and the lakes—will be gone.
The tragic irony is that once the era of extreme flooding ends, Nepal and the billions of people living downstream in the Ganges, Indus, and Brahmaputra basins will face an even more insidious disaster: chronic, severe water scarcity and drought. The destruction of the dams today precedes the emptying of the rivers tomorrow.
You have just identified one of the most dangerous psychological phenomenons in disaster studies: auditory normalization. In environments like the steep valleys of Nepal, the sound of rushing water is a constant background track. During the monsoon or spring melt, the volume naturally swells. When a glacial lake outburst flood (GLOF) or debris flow begins, the initial acoustic cues are easily mistaken for “just a heavy river day.” By the time the human ear can distinguish the terrifying, earth-shattering roar of a debris flow from a normal flood, the flow is usually just seconds away.
To answer your question directly: Yes, this exact problem has been extensively studied, and acoustic/seismic monitoring is currently at the cutting edge of debris flow early warning systems.
Here is how scientists and engineers are using sound to strip away human hesitation and buy communities those crucial minutes of life-saving time.
Chapter 6: The Acoustic Signature of Annihilation
The human ear is highly fallible when it comes to low-frequency danger. But a machine does not suffer from normalization.
When researchers began studying how to detect debris flows upstream, they realized that standard water-level gauges (trip-wires or radar height sensors) had a fatal flaw: they only trigger when the water has already arrived at the sensor. If the sensor is destroyed, the signal stops. Instead, scientists turned to seismo-acoustic monitoring, utilizing two specific types of sensors placed kilometers upstream of vulnerable settlements:
-
Geophones (Seismic Sensors): These measure vibrations traveling through the ground.
-
Infrasound Microphones (Acoustic Sensors): These measure low-frequency sound waves traveling through the air.
The Frequency of a Disaster
A debris flow does not sound like a flood to a sensor. Clear-water floods create higher-frequency splashing and rushing noises. A hyper-concentrated debris flow—carrying boulders the size of cars—operates on a completely different acoustic spectrum. As massive rocks grind against the bedrock and each other, they produce deep, rumbling infrasound.
Infrasound consists of acoustic waves below the threshold of human hearing (typically between 3 Hz and 15 Hz for debris flows). Because these waves have very long wavelengths, they do not easily scatter or absorb. They can travel for kilometers through the air, bending around mountain ridges and penetrating dense forests with almost no energy loss. Simultaneously, the heavy impacts send ground vibrations (typically between 10 Hz and 50 Hz) racing through the earth.
Real-World Studies and Outcomes
Extensive field tests and implementations have been conducted over the last decade, particularly in Taiwan (which suffers heavily from typhoon-induced debris flows) and the European Alps.
1. The Taiwan Studies (Ai-Yu-Zi Creek)
Researchers in Taiwan deployed geophone arrays to monitor debris flows. They specifically tackled the exact problem you raised: how to filter out the normal “ambient noise” of the river, rain, and even passing vehicles.
-
The Outcome: They developed algorithms that continuously measure the ambient background energy over 10-minute rolling windows. When the sensors detect a sudden, massive spike in the 10–40 Hz frequency range that is an order of magnitude higher than the background noise, the system confirms a debris flow. In testing, this algorithm successfully detected the arrival of debris flows automatically, often faster than human observers watching via live video feeds.
2. The MAMODIS System (The European Alps)
In Europe, researchers installed a system called MAMODIS (Monitoring and Alarm System for Debris Flows) across test sites like the Illgraben in Switzerland, Lattenbach in Austria, and Gadria in Italy. This system uses a combined infrasound sensor, a geophone, and a localized microprocessor.
-
The Outcome: Because the microprocessor analyzes the sound at the sensor site in real-time, it doesn’t need to send heavy data files over unstable mountain internet. It continuously runs a Fast Fourier Transform (a mathematical algorithm) on the audio. If it detects the specific 3–15 Hz infrasound signature of a debris flow, it immediately fires a radio signal downstream. These systems have proven highly reliable at distinguishing between “muddy floods” and “boulder-rich debris flows,” drastically reducing false alarms.
Application in the Himalayas
If we apply this acoustic technology to the Nepal scenario you envisioned, the architecture of survival changes entirely.
Imagine an infrasound array and geophone station mounted safely high on the canyon wall, 3 to 5 kilometers upstream of a settlement. The river is running high from spring melt. A resident hears a roar, but their brain tells them, “It’s just the spring melt, maybe a bit louder today.”
However, two minutes prior, the upstream acoustic sensor felt the earth vibrating at 30 Hz and “heard” the 5 Hz infrasound of boulders crushing together. The algorithm instantly recognized the acoustic signature of a 1.8 ton/m³ debris flow.
It automatically triggered the sirens in the valley and blasted the localized SMS alerts. The resident doesn’t have to debate whether the river sounds louder than yesterday. The siren acts as an immediate, absolute cognitive override. Combined with the urban planning (escape gaps) and behavioral training (evacuation drills) discussed earlier, the resident instantly executes their vertical sprint up the valley wall long before the water ever breaches the banks.
By offloading the detection to acoustic algorithms, we remove the deadly delay of human interpretation.
Conclusion
The flooding witnessed in Nepal represents one of the most extreme expressions of kinetic energy on Earth. Attempting to build rigid structures to block 1.8 MPa of debris flow is a losing battle against physics. Instead, the solution lies in intelligent adaptation.
By continuing to expand their world-class mass SMS early warning systems, mapping the precarious bathymetry of upstream lakes, and fundamentally rethinking mountain urban planning to allow for vertical, 90-degree escape corridors, the people of Nepal are laying a blueprint for climate resilience. The challenge is immense, but the ingenuity of the communities in the Thame, Melamchi, and Trisuli valleys—who have lived in the shadow of these mountains for centuries—is more than capable of rising to it.