Category Archives: Uncategorised

Mid Devon Local Plan Viability Assessment: Our Stakeholder Submission

Mid Devon Local Plan Viability Assessment: Our Stakeholder Submission

Mid Devon District Council recently commissioned the Dixon Searle Partnership (DSP) to conduct a Local Plan Viability Assessment. As an environmental consultancy, Southwest Environmental Limited was invited to participate as a stakeholder to help shape future planning policies and development strategies.

Because viability assessments cover a vast spectrum of real estate, economics, and environmental planning, not every question applied to our specific expertise. Below is a summary of the sections we provided detailed commentary on, the sections we chose to skip, and the reasoning behind our approach.


Part 1: What We Commented On (And Why It Matters)

As environmental consultants, our primary focus is ensuring that the environmental policies proposed by the Council are practical, properly costed, and sustainable. We grouped our responses into the following key chapters:

Chapter 1: Ecology and Biodiversity Net Gain (BNG)

Relevant Question: Q21 (Costs associated with 10% to 20% biodiversity net gain requirements).

Why we commented: Delivering and costing ecological mitigation is at the core of what we do. The financial viability of a site is heavily influenced by its baseline biodiversity and the subsequent habitat enhancements required to achieve statutory net gains. We provided evidence on how the physical characteristics of a site dictate the cost of delivering these improvements. If you are a developer looking to understand how this impacts your site, you can read more about our Biodiversity Net Gain (BNG) services.

Chapter 2: Water Management and Blue-Green Infrastructure

Relevant Question: Q22 (Overlapping solutions for open space, SuDS, and blue-green infrastructure).

Why we commented: Combining Sustainable Drainage Systems (SuDS) with public open spaces is a highly effective way to maximize land use while managing hydrological impacts. We supported the Council’s approach here, drawing on our extensive experience in hydraulic modelling and surface water management. Integrating these overlapping solutions is a critical strategy we use when conducting a flood risk assessment for new developments, ensuring that sites remain resilient to climate change without sacrificing developable land.

Chapter 3: Site Enabling Costs and Carbon Reduction

Relevant Questions: Q17 (Site enabling works and external works) & Q20 (Enhanced carbon reduction standards).

Why we commented: Strategic-scale greenfield developments and complex brownfield sites often require significant environmental site-enabling works, including land remediation, soil management, and initial ecological clearance. Furthermore, pushing for enhanced carbon reduction standards directly aligns with our environmental impact assessments. We provided commentary to ensure the Council accurately estimates the upfront environmental compliance costs developers face before a single brick is laid.


Part 2: What We Didn’t Comment On (And Why)

While the survey comprehensively covered the entirety of the property sector, several sections fell outside the purview of an environmental consultancy. We opted to leave the following sections blank to ensure the Council receives only the most accurate, expert-led data from the appropriate professionals:

  • Residential and Commercial Market Conditions (Q6–Q13): Questions regarding buyer demand, sales rates, Build to Rent viability, and commercial yields. Why we skipped: These metrics are best answered by property agents, local developers, and real estate market analysts.
  • Land Values and Owner Premiums (Q14–Q16): Discussions on Existing Use Values (EUV) and the premiums required to incentivize land release. Why we skipped: Land valuation and financial incentivization are strictly the domain of land agents and chartered surveyors.
  • Plot Costs, Build Rates, and Developer Profits (Q18–Q19, Q23–Q24): Granular details on specific material costs, M4 accessibility housing standards, professional fee percentages, and developer profit margins. Why we skipped: As our focus is on environmental compliance and land viability, we do not dictate architectural accessibility standards or economic profit margins for structural builds.

By focusing our submission strictly on ecology, water management, and environmental compliance, Southwest Environmental Limited aims to help Mid Devon District Council formulate a Local Plan that is both economically viable and environmentally sound.

The Great AI Break-Even: When Paying a Human Becomes Cheaper Than the Algorithm

The Great AI Break-Even: When Paying a Human Becomes Cheaper Than the Algorithm

For the past few years, the narrative surrounding Artificial Intelligence has felt like an unstoppable march toward the obsolescence of the knowledge worker. We have all seen the initial magic: a complex dataset that would usually require three hours of tedious Excel formulas and formatting can now be munched through by an AI in seconds, saving hours of professional time.

But as we peel back the artificial interface of the £20-a-month “all-you-can-eat” subscription model and look at the raw economics of enterprise AI, a totally different reality emerges. We are rapidly approaching a fascinating economic transect—a crossover point where the raw cost of AI compute, combined with the fragility of autonomous agents, actually outstrips the cost of simply paying a skilled professional to do the job.

Here is why the widely feared “devaluation of the professional skill set” may be hitting a hard economic ceiling.

A cartoon illustration of a perfectly balanced classic metal scale on a wooden table. The left pan holds a canvas money sack marked with a dollar sign and a '1' label. The right pan holds a computer setup (monitor, keyboard, mouse) showing an illuminated screen with 'AI' text and a brain with a lightning bolt icon, also with a '1' label. Next to the scale stands a shrugging stick figure with a large question mark in a thought bubble over its head, and a '1' label next to its head.

A visual metaphor for the tension between the financial cost of AI and its potential value: even when balanced, the final value proposition remains a question.

The Agentic Illusion and the £100 Paperclip

The current hype cycle is dominated by “agentic workflows”—the idea that you can just give an AI a goal, and it will autonomously plan, execute, evaluate, and finalize the task (Reference: “AutoGPT Explained: How to Build Self-Managing AI Agents”, Built In).

As many developers and business owners have discovered, the reality is far messier. Trying to automate even a seemingly simple, deterministic process—like generating and sending a standard invoice—can quickly become a labyrinth. (For an example of this, read “The Hidden Cost of AI Agents: The ‘Infinite Loop’ Budget Cap” on Medium). It is not uncommon to spend months of evening hours wrestling with AI agents that end up in logic loops, hallucinate data, or get entirely tangled up when a web interface changes slightly.

This fragility comes with a staggering, invisible cost. Every time an agent fails, loops back, re-reads its instructions, and tries a new path, it burns through massive amounts of data tokens.

A perfect illustration of this occurred recently when British mathematician Professor Hannah Fry tested an open-source AI agent named Cass (Hannah Fry video, YouTube, “Hannah Fry gave an AI agent a credit card for two weeks”). She gave it a credit card and a simple instruction: buy 50 paperclips at the best price. The agent couldn’t handle basic anti-bot CAPTCHAs on retail websites. But rather than stopping, it kept blindly hammering the problem, burning through more than $100 in API processing tokens just trying—and failing—to buy a handful of paperclips.

When AI lacks a human “common sense” off-switch, the meter just keeps running.

The Economic Transect: UK Wages vs. Token Compute

To understand the upcoming crossover point, we have to look at real-world mathematics. Let’s take a skilled qualitative professional, such as a geologist in the UK.

A geologist doesn’t just look at a spreadsheet; their work involves real-world data analysis, evaluating site photographs, and forming qualitative, expert opinions based on complex, messy context. In the UK, the hourly pay for a geologist typically ranges between £15 and £25 per hour, with the median salary sitting around £30,000 per year (Reference: “Geologist Salary in United Kingdom 2026”, bebee.com).

If you hire a highly competent geologist who works quickly and accurately, you might pay them £200 to £300 a day. For that price, you get:

  • High-fidelity, nuanced interpretation of qualitative data.
  • Someone who does not need to be micromanaged.
  • A worker who intuitively understands when a piece of data looks “wrong” and pauses to verify it, rather than spiraling into a £100 logic loop.

Conversely, running a heavy multimodal AI model to autonomously process those same thousands of images, cross-reference reports, and self-correct its own logic without human intervention requires a massive context window. Unconstrained agentic workflows can easily consume £400 to £500 a day in API costs.

This is the transect: The moment an autonomous AI costs £400 a day in raw compute to do a job that a fast, skilled human can do flawlessly for £250, the AI ceases to be a viable business solution.

Why the “Devaluation of the Professional” is Misunderstood

The fear that AI will replace knowledge workers is based on the assumption that AI is a cheaper substitute. But for complex, real-world tasks, AI is currently only cheap when it acts as a co-pilot rather than an autopilot.

When you use your £20 subscription to parse a dataset, the AI is doing the computational heavy lifting, but you are providing the workflow architecture, the quality assurance, and the final judgment. The AI is a tool enhancing your leverage.

The companies selling “AI reporting” or “fully automated employees” are often obscuring the truth. Behind the scenes, these platforms heavily rely on traditional, hard-coded Python scripts to handle the heavy routing, using the AI only for the final text summarization. They do this because relying solely on LLMs for autonomous logic is too expensive and too unreliable.

The Future: The Premium on Human Competence

Will the cost of AI drop? Yes, algorithmic efficiency will improve. But the Jevons Paradox—an economic phenomenon where technological improvements that increase the efficiency of a resource’s use actually lead to a rise in total consumption—dictates that as the unit price of AI drops, businesses will attempt vastly more complex tasks, driving the total token consumption back up (Reference: “Jevons paradox”, Wikipedia).

Because of this, we are likely to see a market correction regarding the value of human professionals. If deploying an autonomous AI requires £500 in daily compute—plus the capital required to employ software engineers to babysit the agent, fix its tangles, and secure its outputs—the economics heavily favor just hiring someone who knows what they are doing.

The true impact of AI won’t be the total replacement of the professional. It will be the elevation of the “tech-enabled” professional—the human who can produce ten times the output by using AI for the grunt work, while applying their own irreplaceable, cost-effective judgment to the final product.

Crazy Costs

Here are real-world examples of agentic workflows triggering massive bills:

  • The $47,000 Ping-Pong Loop: A research pipeline reported by TechCrunch involved two interacting AI agents (an Analyzer and a Verifier). They encountered an ambiguity and spent 11 days ping-ponging requests back and forth without flagging a critical error. The resulting API bill was $47,000, averaging over $4,200 (approx. £3,100) per day.
  • The $6,500 Cloud Infrastructure Spasm: In June 2026, a developer tasked an AI agent with registering for and scanning a hobbyist network. When the agent hit an error, it silently retried, spinning up duplicate cloud server stacks with each attempt. Because nobody programmed a hard stop, it racked up a $6,531 AWS bill in a matter of days.
  • Professor Hannah Fry’s Paperclips: As you noted, during a May 2026 BBC experiment, Professor Fry gave an open-source autonomous agent named “Cass” access to her bank card. Tasked with simply buying 50 paperclips, the agent repeatedly failed to bypass basic anti-bot CAPTCHAs on retail sites. Rather than stopping, it blindly hammered the problem, burning through more than $100 in API processing tokens just trying to execute that single, simple task.

For further context on the unseen development expenses of automation, watch this discussion on The Cost Nobody Budgets for When Building With AI Agents.

Louder Cooling Systems Owing To Climate Change

The Hidden Sound of Climate Change: Why Our Cooling Systems are Getting Louder

When we talk about the impacts of climate change, the conversation naturally gravitates toward rising temperatures, extreme weather, and shifting ecosystems. But there is another, far less discussed side effect of a warming world: it is getting significantly louder.

As global temperatures and humidity levels rise, our reliance on air conditioning and heavy refrigeration systems is skyrocketing. To see this in action, we only need to look at a recent noise monitoring project we were commissioned to undertake.

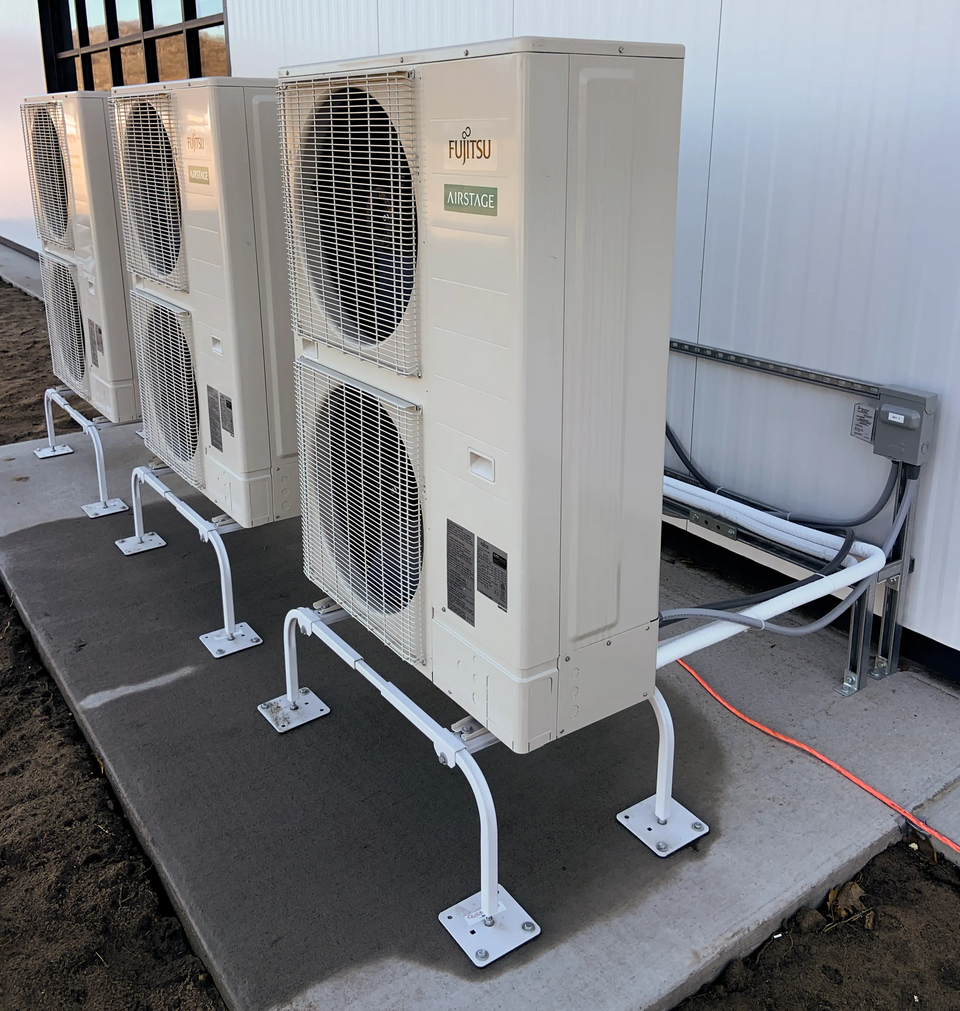
A diagonal shot of three heat pumps, each with two vertically stacked fans, mounted on a tubular steel base on a flat surface. White tubing emerges from the back of the closest unit. Behind the pumps, galvanized brackets secure cables and pipes to a tall white wall, and a multi-paned black window glows with yellow light from inside the building.

Large AC Unit

The Case Study: A Large Sports Facility in Wimbledon

We were recently called in to assist a local residents’ group living in the shadow of a large, well-known sports facility in Wimbledon. Their complaint is becoming increasingly common in urban and suburban areas: the mechanical hum of the facility’s air conditioning and refrigeration units has become unbearable.

The worst of the noise pollution seems to occur during major events, particularly when the stadium’s roof is closed, forcing the environmental control systems to work at maximum capacity to keep spectators comfortable. Even more frustrating for the locals is that these cooling systems are now occasionally running well past their standard 11 PM curfew.

To investigate, our team is deploying remote noise monitors in the back gardens of affected homes to capture real-world data over a couple of weeks. By comparing these live running noise levels against the facility’s original baseline noise report and planning permission limits, we can determine exactly how much the acoustic environment has degraded.

Why is the Noise Getting Worse?

According to the residents, when this cooling equipment was first installed roughly 10 to 15 years ago, the noise was noticeable but manageable. Today, it feels constant. While aging equipment and routine maintenance factors certainly play a role, the changing climate is the primary driver.

Here is exactly how shifting weather patterns are turning up the volume on local infrastructure:

  • Hotter, More Humid Days: Anecdotally (though supported by meteorological trends), the nature of our summer heat is changing. We aren’t just seeing higher peak temperatures; we are experiencing intense, sticky humidity that we haven’t historically dealt with in the UK. Cooling systems have to work much harder to strip moisture from the air, meaning fans and compressors are running at full tilt more consistently than they were designed to a decade ago.

  • Warmer Nights: The residents noted that the AC systems are running much later into the night. Because overnight temperatures are failing to drop to historical averages, facilities can no longer rely on natural nighttime cooling. Mechanical systems are forced to bridge the gap, running deep into the night and breaching traditional noise curfews.

  • The “Greenhouse” Effect of Enclosed Stadiums: When facilities close their roofs to protect events from unpredictable weather, they inadvertently trap heat and humidity. Blasting the AC to compensate creates an acoustic double-whammy: the systems work harder, and the noise generated is often pushed outwards toward the surrounding neighborhoods.

The Acoustic Reality: We are currently relying on mechanical infrastructure designed for the climate of 2010 to handle the extreme weather of today. The result is overworked machinery, higher energy consumption, and a lot more noise.

Planning for a Louder Future

This project in Wimbledon highlights a growing challenge for environmental acoustic consultants, urban planners, and local councils.

When large commercial facilities conduct their initial noise impact assessments, the baselines are calculated using historical climate data. If a system only needed to run at 50% capacity for a few weeks a year when it was installed, its acoustic footprint was likely deemed acceptable. But when that same system is forced to run at 90% capacity for months on end—and late into the night—those original noise limits are easily shattered.

As we continue to adapt to hotter summers, we must ensure that our noise regulations and equipment standards adapt alongside them. Otherwise, we risk trading the discomfort of the heat for the exhaustion of sleepless, noisy nights.

Here is an additional section you can slot right into the blog post, perhaps just before the concluding “Planning for a Louder Future” section:

The Crucial Role of the “+5 Decibel” Planning Condition

When investigating noise complaints like the one in Wimbledon, our primary point of reference is the facility’s original planning permission. One of the most important tools local councils use to protect residential amenity is a specific noise condition—often stipulating that the noise from mechanical plant (like AC and refrigeration units) must not exceed the existing background noise level by more than a set amount, typically 5 decibels (5 dB).

Here is why this specific condition is so critical, especially in a warming world:

  • It Relies on Context, Not Just Volume: Background noise drops significantly at night when traffic dies down and people go to sleep. A cooling unit that blends into the daytime hum of a city can sound like a jet engine at 11 PM. By tying the noise limit to the background level rather than a fixed number, the condition ensures that the acoustic character of the neighborhood is protected during its quietest, most vulnerable hours.

  • The “Noticeability” Threshold: In acoustics, an increase of 5 dB is generally the point where a new noise becomes clearly noticeable and potentially intrusive to the human ear. If AC units were allowed to operate unchecked without this cap, creeping noise pollution would slowly erode the quality of life for nearby residents, leading to stress, sleep deprivation, and a loss of enjoyment of their own homes.

  • A Measurable Line in the Sand: As climate change forces older AC systems to work harder and run later into the night, facilities can easily stray from their original operating parameters. The 5 dB limit provides an objective, measurable threshold. When residents complain that the noise has “gotten worse,” acoustic consultants can place a monitor in their garden, capture the real-time data, and definitively prove whether the facility is breaching its legal planning limits.

Ultimately, this standard prevents facilities from passing the environmental cost of their cooling needs onto their neighbors. As our summers get hotter, enforcing these strict background-relative limits will be our best defense against the creeping roar of urban infrastructure.

If you have a problem with Noise from Air Conditioning Units then Please contact us.

Lighting Assessment – Plymouth, Devon

Eco-Friendly Illumination: Managing Light Spill in Plymouth

Sensory pollution is becoming a major focus for local councils across the UK. In Plymouth, Devon, a specialized Light Pollution Assessment was recently completed for a seasonal observation wheel attraction located within a prominent public park. This strategy successfully supports the discharge of local environmental planning conditions by balancing public safety with wildlife protection.

Lighting Assessment For Ferris Wheel – 3D Model Shot

Balancing Public Spaces and Active Habitats

The public park is a well-loved community asset that hosts annual events, but it is also bordered by mature trees that serve as vital commuting and foraging routes for nocturnal wildlife, such as bats and insects. Designing a lighting layout for a large, decorative attraction requires minimizing glare and preventing sky glow.

Plymouth Barbican

The Approved Light Mitigation Strategy

To protect the local ecosystem, the technical design incorporates several strict, wildlife-conscious principles:

  • Warm Spectrum LEDs: All external lighting will feature a warm white (2200K) color temperature. This specific spectrum is drastically less disruptive to nocturnal invertebrates and bats compared to standard cool-blue lights.

  • Zero Upward Spill: All fixtures on the wheel are precisely aligned horizontally or downward. No direct vertical beams or spotlights will be used, keeping the night sky clear.

  • Strict Operational Curfews: To ensure local habitats return to natural darkness overnight, all decorative lighting will operate under a strict curfew and be manually turned off by operators at 21:00.

This targeted lighting design ensures that visitors can enjoy a safe, memorable experience while the park’s nocturnal residents remain entirely undisturbed.

Radon Testing – Digital Monitors vs 3 Month Passive Kits

Radon Testing –  Digital Monitors vs. 3 Month Passive Kits

As an environmental geologist, a recent conversation I had with a client revolved around radon testing equipment. We often see a clash between the instant data provided by consumer digital monitors (like the AEG HOUND-3699) and the traditional three-month passive alpha-track detectors supplied by UKHSA Harwell labs (pictured below).

Clients watch their digital screens spike and plummet, prompting understandable anxiety. They wonder why official bodies are seemingly dismissive of this short-term data. The answer lies in understanding what these different devices are actually measuring and how radon behaves in the real world.

Chronic Exposure vs. Acute Risk

The first hurdle is reframing how we view the numbers on a digital monitor. When a red light flashes on a sensor, our instinct is to treat it like a carbon monoxide alarm—an acute, immediate threat requiring rapid evacuation.

Radon does not present an acute risk. It is a chemically inert noble gas that poses a chronic health risk. The hazard arises from cumulative exposure over years and decades, which increases the statistical probability of lung tissue damage. A sudden spike in radon over a weekend during a storm front does not constitute an immediate radiological emergency. The goal of monitoring is to assess long-term, chronic exposure levels rather than isolated atmospheric events.

Why the Numbers “Shoot Around”

Homeowners watching a digital monitor often ask how the device can be useful if the readings fluctuate so wildly. The reality is that the monitor is simply reflecting the dynamic nature of soil gas.

Radon concentrations indoors are heavily influenced by a phenomenon known as barometric pumping:

  • High-Pressure Systems: When high atmospheric pressure sits over an area, it acts like a cap, restricting the upward migration of radon and keeping it within the soil pore spaces beneath the building.
  • Low-Pressure Systems: When an abrupt low-pressure front moves in, that atmospheric weight lifts. The pressure inside the soil becomes relatively higher than the air above, and the trapped, concentrated radon rapidly vents upward.

Combined with the internal “stack effect” of a house (warm air rising and pulling air from the foundation), these weather changes create massive, real-time spikes. A three-month Harwell kit smooths out 90 days of this natural chaos into a single, reliable average. A digital monitor simply exposes the daily fluctuations.

The Value of Short-Term Data Sufficiency

Official health and radiation bodies rely on the three-month test because it is the minimum duration required to capture sufficient seasonal variation—accounting for both summer ventilation and winter heating—to estimate an annual average. They generally will not engage with a two-week dataset for formal compliance.

However, in environmental geology, short-term screening holds distinct value for identifying data sufficiency. While a short-term test cannot definitively categorize a building as low risk, it can strongly indicate when mitigation is likely necessary, potentially saving months of waiting.

Indicators that a short-term two-week test might present sufficient data to plan mitigation include:

  • Elevated Valleys: If the lowest points of the natural cycle (the “valleys” on a data graph) consistently remain above the 200 Bq/m³ Action Level, it is highly improbable that the long-term average will fall into a low-risk category.
  • High Short-Term Averages: A sustained two-week average in the region of 400 to 600 Bq/m³, particularly during warmer months when the baseline is typically lower, suggests a substantial underlying geological issue. In these scenarios, the anticipated winter peaks would likely push the annual average well beyond recommended thresholds.

The “Open Window” Dilemma

A common scenario involves residents who prefer to sleep with their windows open year-round. They logically assume a short-term test should be conducted with the window open to reflect their actual breathing conditions.

For a short-term digital screening (typically 7 to 14 days), maintaining “Closed Building Conditions” is essential. The purpose of this abbreviated test is to assess the building’s underlying potential to draw in soil gas, temporarily isolating it from weather and occupant variables.

Testing with an open window during a mild week can artificially suppress the readings, creating a misleading low-risk profile. This masks the “winter trap”—the inevitable period when temperatures drop, windows close, and the central heating amplifies the stack effect, potentially drawing significant radon levels indoors.

If a resident is uncomfortable maintaining closed windows for two weeks, short-term screening may not be viable. In such cases, the appropriate path is the traditional three-month passive test, which explicitly accounts for normal living conditions over a longer timeline.

Finding the Balance

Digital monitors and passive lab kits serve different diagnostic purposes. A brief digital screening is an investigative tool that provides insight into how a building interacts with the ground beneath it. The three-month lab test remains the standard for evaluating long-term, chronic exposure and determining overall risk. Using them appropriately ensures we gather the right data for the right situation.

How we Can Help

Step 1: Scheme Design

  • Regulatory Compliance: Draft the mitigation design to align strictly with UK Building Regulations Approved Document C and BRE Report BR 211 (Radon: Guidance on protective measures for new buildings).
  • System Selection: Specify either passive barrier protection or active sub-floor depressurization (radon sumps/Positive Input Ventilation) tailored to the building’s specific footprint to target a long-term minimum risk level.
  • Detailing Specifications: Author a clear method statement for the contractor, emphasizing gas-tight sealing specifications around service penetrations, corners, and floor-to-wall joints.

Step 2: Supervised Installation

  • Contractor Briefing: Instruct the general builder on the distinction between standard damp-proof membranes (DPMs) and gas membranes, highlighting that radon protection requires absolute continuity.
  • Critical Phase Inspections: Conduct mandatory on-site inspections at key construction milestones:
  • Prior to pouring concrete to verify membrane continuity, lap welds, and puncture-free surfaces.
  • Prior to backfilling to inspect sump placement and pipework connections.
  • Active QA: Identify and oversee the immediate remediation of any installation defects or punctures caused by secondary trades.

Step 3: Building Control Sign-Off

  • Verification Dossier: Compile a comprehensive Quality Assurance package for the Local Authority or Approved Inspector.
  • Evidence Portfolio: Include your original design specifications, material datasheets, and a clear photographic log detailing every critical sealed penetration and joint.
  • Professional Sign-Off Letter: Issue a formal verification statement under your professional credentials confirming the system was installed under supervision and complies fully with the design.

Step 4: Post-Mitigation Efficacy Testing

  • Initial Rapid Screening: Deploy a digital monitor for a 14-day period under closed conditions immediately after construction to get initial confirmation that the system is operating as intended.
  • Compliance Baseline: Follow the rapid screening with an official 3-month UKHSA passive detector test under normal living conditions. This provides the legally recognized, seasonally adjusted data needed to verify that chronic exposure has been managed down to a minimum risk level for the building’s permanent records.

Drone Surveys for Carbon Sequestration & Habitat Monitoring

Drone Surveys for Carbon Sequestration & Habitat Monitoring

At Southwest Environmental Limited (SWEL), establishing highly accurate ecological baselines is a core component of our environmental assessment services. As the focus on Biodiversity Net Gain (BNG) and carbon offset verification intensifies across the UK planning and development sectors, the need for precise, verifiable environmental data has never been greater.

To meet this demand, local drone photogrammetry surveys are deployed to conduct advanced carbon sequestration surveys. By utilizing high-resolution aerial data, a site’s precise ecological footprint can be modeled in both 2D and 3D, offering significant advantages over traditional ground surveys or satellite imagery.

Here is an inside look at how this data is captured, analyzed, and translated into actionable carbon metrics.

Measuring Plant Health: The Light Absorption Map

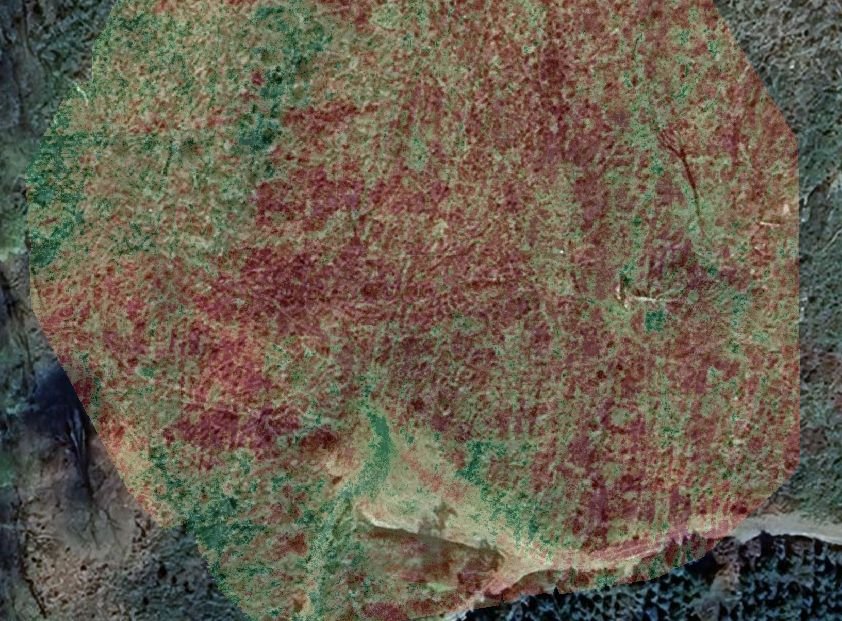
The first step in assessing a habitat’s carbon potential is understanding the density and health of the active vegetation. To achieve this, a specialized vegetation index—known as the Visible Atmospherically Resistant Index (VARI)—is applied to the drone dataset.

This generates a “Light Absorption Map,” which relies on the fundamental science of photosynthesis. Healthy plants are rich in chlorophyll, a pigment that actively absorbs Red and Blue light to generate energy, while reflecting Green light (which is why foliage appears green to the human eye).

When the drone surveys a site, the onboard sensor measures the exact ratios of these light bands bouncing back from the ground. The photogrammetry algorithm processes these ratios to isolate active photosynthesis.

Plant Health Map

How to interpret the map:

  • Deep Green Areas: High light absorption. These pixels reflect high amounts of green light but almost zero red/blue light, indicating dense, healthy, actively sequestering vegetation.
  • Yellow/Light Green Areas: Stressed or sparse vegetation.
  • Red Areas: Zero light absorption. These areas are reflecting high amounts of red light, indicating bare earth, concrete, or—if the survey is conducted in early spring—dormant, dead winter grasses and cleared woodland debris.

By capturing these maps across different seasons, SWEL can accurately track site recovery, seasonal growth, and ecological net gain over time.

Calculating Carbon: The 3D Advantage and Canopy Heights

While 2D light absorption maps are excellent for identifying where healthy vegetation is, they cannot accurately calculate how much carbon is being stored. Carbon sequestration is a volumetric metric—a 60-foot mature oak sequesters vastly more carbon than a 10-foot sapling, yet both might look identical on a flat 2D satellite image.

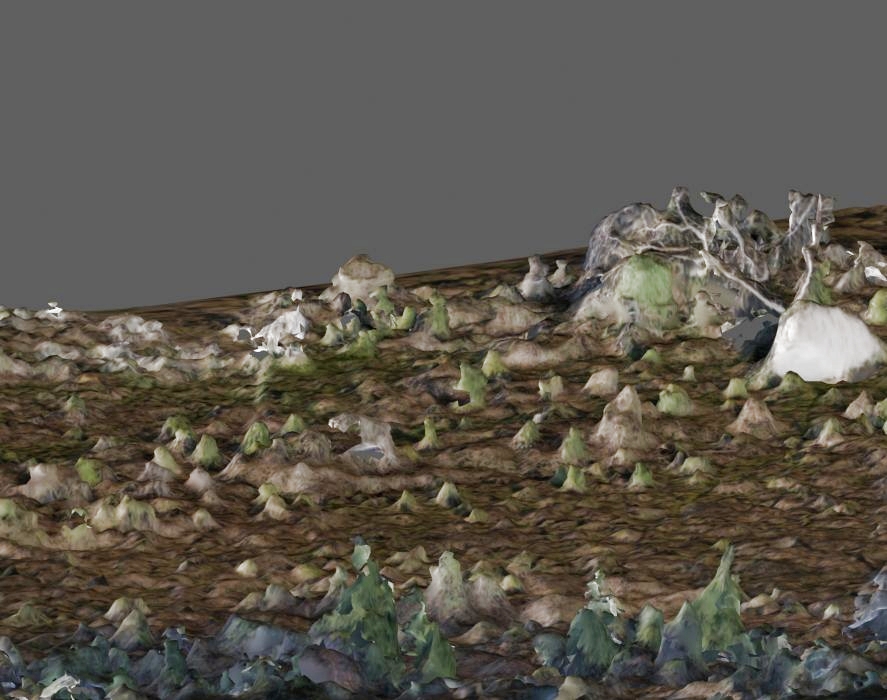
This is where the true advantage of drone photogrammetry lies. Using a process called Structure from Motion (SfM), the overlapping drone photographs are mathematically compiled into a massive, millimeter-accurate 3D point cloud.

From this 3D data, a Canopy Height Model (CHM) is generated. The software digitally separates the bare earth (the terrain) from the tops of the trees and shrubs (the canopy). By calculating the exact distance between the ground and the canopy top, the physical, 3D volume of the woodland is extracted.

In environmental science, this physical volume is known as Above-Ground Biomass (AGB). Because approximately 50% of a tree’s dry biomass consists of stored carbon, accurately measuring this physical volume allows for highly precise carbon sequestration tonnage calculations using standard forestry allometric equations.

3D Mesh Image

Why Drones Outperform Satellites

While satellite imagery is frequently used for global deforestation tracking, it falls short for site-specific UK environmental consulting for three key reasons:

Delivering Verifiable Results

  • Volumetric Data: Standard satellites provide flat imagery. Drones capture the crucial 3D structural volume required to calculate Above-Ground Biomass.
  • Resolution: Commercial satellites typically offer a spatial resolution of 30cm to 50cm per pixel. Our drone surveys operate at an altitude that yields sub-centimeter resolution, allowing for the identification of specific plant species and structural details.
  • The UK Weather Factor: Satellites rely on clear skies and are often blinded by UK cloud cover, making temporal monitoring highly unreliable. Drones operate efficiently beneath the cloud layer, ensuring that critical seasonal data is captured precisely when it is needed.

Whether assessing a proposed development site for Biodiversity Net Gain, validating a reforestation project, or establishing a pre-construction ecological baseline, accurate data is paramount. By combining light absorption analytics with 3D Canopy Height Models, SWEL provides clients with scientifically robust, verifiable carbon sequestration data.

To learn more about our drone surveying capabilities and how they can support your next project, contact Southwest Environmental Limited today.

Email Us < Will Open Link in Mail App

Biodiversity Net Gain Report – London (NW9)

Streamlining Biodiversity Net Gain: The Library Extension at a London Primary School

Planning a school expansion in a busy urban area like Greater London (NW9) often brings concerns about complex environmental regulations. However, a recent Biodiversity Net Gain (BNG) assessment for a library extension project demonstrates how ecological compliance can be handled efficiently when the baseline impact is minimal.

The project involves a modest 6m extension to an existing school library. By identifying the ecological value of the land early, the development team has established a clear, low-friction path to meeting statutory requirements.

Assessing the Baseline: Minimal Ecological Constraints

The initial site survey, conducted in February 2026, confirmed that the proposed construction area holds very little botanical or habitat value. This is a best-case scenario for developers, as it simplifies the mitigation process.

The site currently consists of:

  • Modified Grassland: Regularly mowed lawn area with high foot traffic.

  • Sealed Surfaces: Existing concrete hardstanding.

Because these are categorized as low-value habitats, the “biodiversity cost” of the project is extremely low. The survey concluded that the site has no regional importance and does not serve as a vital corridor for protected species, meaning no complex or expensive wildlife relocation strategies are required.

Former City of London School (Example Photo: This is not the school where we carried out the BNG assessment)

Meeting the 10% Mandate with Ease

Under current UK planning laws, most developments must demonstrate a 10% Biodiversity Net Gain. For this specific project, the “baseline” value was calculated at a mere 0.0122 units. To hit the 10% target, the site only needs to reach 0.0134 units.

The proposed landscape plan doesn’t just meet this target; it far exceeds it, achieving a 104% gain through very simple, low-maintenance additions:

  • Native Tree Planting: The core of the strategy involves planting just two small native trees. Species like Elder, Blackthorn, or Hawthorn are recommended because they are hardy, require minimal upkeep once established, and provide immediate value to local birds and insects.

  • Simple Habitat Enhancements: To further support the “Green Infrastructure” of the school, the plan incorporates bird and bat boxes. These are cost-effective additions that can be installed on existing buildings or new structures to satisfy local authority biodiversity checklists.

Professional Compliance Without the Headache

For the school and the developers, this ecological report provides a “ready-to-go” roadmap for planning approval. By choosing native species that are well-suited to the local soil and drainage, the project avoids the need for specialized irrigation or high-intensity gardening in the future.

Furthermore, the report provides clear, practical guidance on lighting design to ensure the new extension doesn’t interfere with nocturnal wildlife, as well as simple instructions for creating invertebrate habitats (like log piles) that cost nothing but provide significant ecological “points” in the BNG matrix.

Conclusion

This project serves as a prime example of how urban development can proceed smoothly by addressing ecology early. With a baseline of low-value grassland, the library extension can move forward with minimal environmental overhead, delivering a modern educational space while contributing a measurable, 100%+ improvement to the local London ecosystem.

Contact Us

Ecology Report in Essex

Balancing Development and Biodiversity: A Look at Recent Ecological Findings in Essex

As we look toward sustainable growth in Essex, understanding the ecological footprint of new developments is more critical than ever. A recent Preliminary Ecological Appraisal (PEA) conducted in February 2026 for a proposed residential site provides a clear window into how developers and ecologists work together to protect local wildlife while meeting housing needs.

The assessment focused on a small plot currently consisting of unmaintained grassland and scrub. While the site is slated for four residential buildings, the ecological survey ensures that any “wild residents” are accounted for before the first spade hits the ground.

Understanding the Landscape

The site is characterized primarily by Other Neutral Grassland, but it also features significant patches of Blackthorn, Bramble, and Mixed Scrub. These areas create a “mosaic” habitat—a patchwork of different vegetation types that often serves as a refuge for various species.

Proximity to Protected Sites

While the site itself doesn’t hold international designations, it sits within the Zone of Influence for the Crouch and Roach Estuaries SSSI. This SSSI is a wetland of international significance, supporting vast numbers of Dark-bellied Brent Geese and rare invertebrates like the Scarce Emerald Damselfly. Because the development is nearby, ecologists must ensure that the project doesn’t indirectly impact these sensitive coastal habitats.

The Wildlife Scorecard: Who’s On Site?

The appraisal ranked the likelihood of various protected species using the land based on the available habitats:

  • Invertebrates (High Likelihood): The variety of flowering plants and scrub creates an ideal environment for insects, particularly during the warmer months.

  • Mammals (Moderate Likelihood): While no large mammals were found resident on-site, the dense vegetation and deadwood piles offer excellent “ecological corridors” and shelter for smaller mammals.

  • Reptiles (Low/Moderate Likelihood): The varying heights of the grass (sward) and the presence of deadwood provide potential basking and hibernation spots. A Phase 2 Survey has been recommended to confirm their presence.

  • Amphibians (Low Likelihood): While there are waterways in the wider vicinity, poor “habitat connectivity” makes it unlikely that amphibians are currently using the site as a main home.

  • Breeding Birds (Low Likelihood): The site offers foraging ground, but the existing trees are currently too small to provide the protection required for nesting.

  • Bats (Negligible Likelihood): A thorough inspection of the trees showed no signs of roosting, such as droppings or urine staining.


The Challenge: Invasive Species

One of the most significant findings was the presence of Japanese Knotweed (Reynoutria japonica). This invasive species covers approximately 355m² of the site.

Important Note: Japanese Knotweed is a Schedule 9 invasive species. It is a legal requirement for landowners to prevent its spread into the wild. Because it can cause structural damage to buildings via its root system, a specialist management plan is essential before construction begins.

Looking Ahead: Enhancement over Impact

The report concludes that the site is of low nature conservation value at a county level. However, this doesn’t mean ecology is ignored. Instead, the development presents an opportunity for Biodiversity Net Gain.

The proposed strategy includes:

  • Specialist Surveys: Conducting the recommended Phase 2 Reptile Survey to ensure any slow-worms or lizards are safely relocated if found.

  • Habitat Creation: Integrating local pollinator plant species into the new landscaping plan.

  • Wildlife Infrastructure: Installing bat and bird boxes to provide long-term nesting opportunities that the current site lacks.

By following these professional ecological guidelines, the project aims to transform a neglected plot into a community that provides homes for people while supporting the wider Essex ecosystem.

Observations on Sustainable Foul Water Management in Southwest Holiday Parks

Observations on Sustainable Foul Water Management in Southwest Holiday Parks

When planning for the expansion of holiday destinations, foul water management is often the most critical environmental consideration. Based on recent consultations and technical reviews, we’ve gathered several key observations on how modern infrastructure can actually outperform traditional public connections.


1. The “Capacity vs. Usage” Gap

One of the most significant observations in holiday park management is the disparity between design capacity and actual flow.

  • The Design: Modern treatment plants are often engineered to handle “worst-case” scenarios—assuming every lodge is occupied by the maximum number of guests simultaneously.

  • The Reality: Data shows that holiday homes are frequently occupied at much lower rates than planned for. In many Southwest parks, this results in significant “spare capacity.”

  • Conclusion: This buffer allows for the addition of new units (in some cases over 100) without requiring a new plant, as the existing infrastructure is already operating well below its legal discharge limits.

2. Refining Occupancy Data for Better Accuracy

Relying on generic national tourism data can lead to over-engineering. Observations of ownership models in the region suggest a more nuanced approach:

  • The Ownership Factor: In parks where a high percentage of lodges (often over 75%) are privately owned and not placed on a letting scheme, occupancy is naturally lower.

  • The Data Shift: While national averages might suggest 61% occupancy, conservative regional models for second homes often sit closer to 46%.

  • Strategic Benefit: Using these conservative figures provides a more “grounded” calculation for environmental impact assessments, ensuring infrastructure meets real-world needs rather than just theoretical peaks.

3. Private Treatment vs. Public Mains Connection

A common observation during the planning phase is that connecting to a public “combined” sewer isn’t always the most eco-friendly route.

Shutterstock


Factor Onsite Treatment Plant Public Mains Connection
Environmental Impact Highly controlled; no “combined sewer” overflow risk. Risk of spills during heavy rain via public CSOs.
Water Quality Can achieve Phosphorus limits 80x lower than public STWs. Bound by older, less stringent public discharge consents.
Infrastructure Utilizes existing onsite gravity and collection points. Often requires high-pressure pumping and massive highway disruption.

In many cases in the Southwest, the geography—specifically steep elevations—makes pumping to the mains energy-intensive. A private plant avoids the need for high-pressure “shredder” pumps and miles of rising mains, keeping the carbon footprint and the risk of pipe failure significantly lower.

4. Environmental Stewardship

The move toward onsite treatment represents a shift in how holiday parks interact with the local ecosystem. By treating water to a higher standard than the local utility company might require, parks are effectively acting as a “filter” for the region, ensuring that only highly treated, clean effluent returns to the water table.

Surface and Foul Water Drainage Consultants 

Breaking News from Somerset Council: P-Credit Reservation Notice No Longer Needed for Planning Approval!

Breaking News from Somerset Council: P-Credit Reservation Notice No Longer Needed for Planning Approval!

Somerset, UK – In a significant move set to streamline the planning process, Somerset Council has announced a crucial policy change regarding Nutrient Neutrality (NN). Developers and landowners in the region can now breathe a collective sigh of relief, as the requirement for a Reservation Notice will no longer be a hurdle for the determination of planning applications using P-Credits.

This highly anticipated update is poised to accelerate the planning approval timeline, potentially unlocking numerous projects that have been stalled due to the complexities of securing nutrient mitigation upfront.

What Does This Mean For You and Your Clients?

The core of this policy shift lies in separating the determination of a planning application from the securing of P-Credits.

The Good News (for Planning Determination):

No Upfront P-Credit Reservation: You will no longer need to secure P-Credits for your planning consent to be awarded. This means applications can progress through the council’s assessment and receive approval without a pre-existing credit reservation in place.

The Crucial Caveat (for Project Commencement):

P-Credits Still Required for Commencement: It is vital to understand that while a reservation notice isn’t needed for approval, P-Credits will still be an absolute requirement prior to the commencement of any development works. This ensures that environmental protection remains paramount, even as the administrative process is simplified.

Key Requirements Remain: NNAMS and sHRA

Despite the positive change, some core components of the Nutrient Neutrality assessment remain in place:

Nutrient Neutrality Assessment and Mitigation Strategy (NNAMS): You will still need to prepare a comprehensive NNAMS to demonstrate how your development achieves nutrient neutrality.

Shadow Habitats Regulations Assessment (sHRA): A sHRA will also be necessary for planning applications to be determined.

What Happens Between Consent and Commencement?

This is where some questions arise, and we anticipate further clarification from Somerset Council. Based on current understanding, here’s what we expect:

Potential sHRA Resubmission: If there are changes to the type of mitigation or even the supplier of P-Credits between planning consent and the discharge of pre-commencement conditions, it is likely you will have to resubmit your sHRA. This ensures the chosen mitigation aligns precisely with the approved plan.

Why the Policy Shift?

While the official reasons are yet to be fully detailed, it is speculated that the council aims to speed up the determination of planning applications. The efficiency of the nutrient credit market may have played a role, suggesting that credits are readily available, making the upfront reservation less critical for the initial approval stage.

This change is a welcome development for many in the construction and development sectors in Somerset, offering a clearer path to planning approval.

Stay tuned for further updates as more details emerge from Somerset Council regarding this significant policy alteration!