 Southwest
Environmental LimitedSouthwest
Environmental Limited
Southwest
Environmental LimitedSouthwest
Environmental Limited| London |
| 02076 920 670 |
| Exeter |
| 01392 927 961 |
| Manchester |
| 01612 970 026 |
| Bristol |
| 01173 270 092 |

Perhaps one of the most important parts of compiling a flood risk
assessment is the data it relies on. This comes from many sources and
can give lots of information of flood depths, water velocity, and
condition of flood defenses. All this is and more is sometimes
available, and enable you to make the best possible case to the
Environment Agency when writing a flood risk assessment.
If you are searching for data in
London, or you are
close to a Major River chances are you will get the data you need, but
there are many circumstances where you will have virtually no data at
all.
One such circumstance is creating an up to date flood level from
outdated J Flow Data, a modeling technique developed by
JBA
Consulting.
J Flow data is the data used to construct the
flood map for
planning. But owing to uncertainties in the model and constantly
changing opinions on the severity of climate change impacts the EA now
often insist that a "climate change allowance" is added.
Details for climate change allowance are given on the
gov.uk website as part of
PPG. The allowances aim to account for increases in peak river flow
account for climate change.
The most commonly chosen allowance is "Higher Central", which range from a 30% to 45% flow increases. Of course taking an existing outdated flood zone and applying this 30%, 35%, 40% or 45% increase requires some maths. It is not complicated maths, but its is time consuming.
There are various modeling programs that will do all these calculation for you. But you will need to feed the model with some data in order to do this. Using modeling software such as TuFlow, you can also remodel the flood zone to account for flow increases but trying to use a complex piece of modeling software is not always that easy!
A relatively easy method is to use a cross section area method. For small channel cross section up to 50 meters, it may be possible to work out cross sectional areas on paper. Graph paper is best, as you can count squares to get area. But for larger areas you will need to use a CAD program. This is because even for small flood plains the depth can be very small relative to the width, and the shapes are ungainly making manual area calculation very difficult.
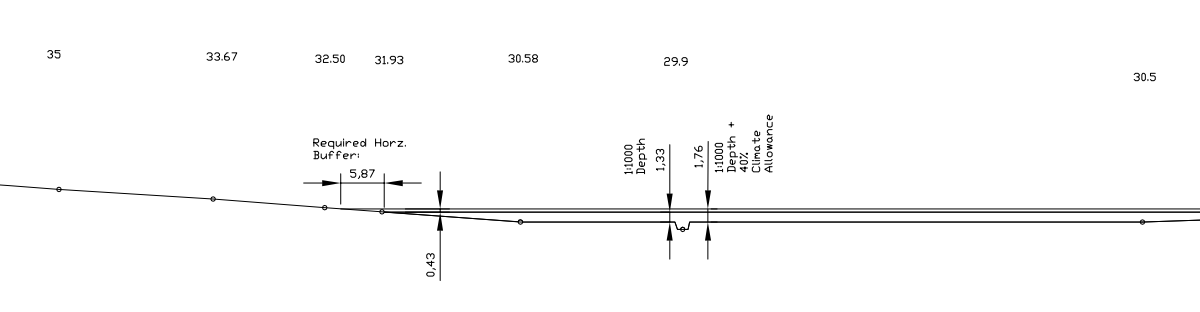
When you have worked out the cross sectional area of the flood scenario, you then add your climate change allowance on top. Original area plus 30%, 35%, 40% or 45% depending on the allowance required. As you can see above this will then give you your buffer, which is "added" on to the existing flood zone.
It is worth noting that in an area with steep topography such as the above cross section the climate change allowance may not make much difference, but in areas where the sides of you channel / valley are more shallow, the adjustment could lead to some unwanted loss of you site to flood plain.
Using this method and other SWEL can redraw flood maps to account for climate change allowances. We can redraw / adjust Flood Zone 1, Flood 2 and Flood Zone 3 Lines. If you would like our help please call for a free chat / complementary consultation.