 Southwest
Environmental LimitedSouthwest
Environmental Limited
Southwest
Environmental LimitedSouthwest
Environmental Limited| London |
| 02076 920 670 |
| Exeter |
| 01392 927 961 |
| Manchester |
| 01612 970 026 |
| Bristol |
| 01173 270 092 |
A Noise Impact Assessment is a report
 Do you require a noise
impact report, if so then please contact
Southwest Environmental for a quotation. We also offer noise monitoring
services.
Do you require a noise
impact report, if so then please contact
Southwest Environmental for a quotation. We also offer noise monitoring
services.
During construction their will normally be an
increase in noise, which can impact on neighbors.
Some developments will have a negative noise
impact, as they may replace older developments with a higher noise
footprint one example of this might be the redevelopment of a dockyard
to seafront residential apartments.
In most cases there will be an positive noise
impact, new roads, wind farms and industrial centers will all generally
create more noise than the previous site use.
Noise is considered as a form of pollution and as
such any "noise" component of an environmental impact assessment will
include:
- Baseline Studies- Impact Prediction
- Noise Mitigation
Picking up on one of the above point. Mitigation: Mitigation of noise can be accomplished in an umber of ways, one such way is to control the noise at source, this might include fitting larger silencers to motorised plant, or the specialize detuning, of outlets etc.
FAQS for Noise and Vibration Impact
Typical Noise Levels in London
.png) Noise Impact Modeling is is a a critical part of the noise impact
assessment process.
Noise Impact Modeling is is a a critical part of the noise impact
assessment process.
Noise impact baseline studies must be prepared, but then it is necessary
to derive a post development figure for noise at a particular location.
The sound level must be considered along with barriers, that may
attenuate sounds on its path to the receptpr.
Receptors for noise can be humans, and natural. Amenity areas should
therefore be considered that offer a degree of tranquility.
Dependent on the level of detail required within the model noise modeling can be a relatively simple, or extremely complex affair.
.png)
| |
Below discussed are some common ideas that relate to the measurement of Noise & Vibration, and their impacts. In order to keep this description simple this guide strays from official guidance and should be considered as an introductory note only.
Noise (Unwanted Sound) and Vibration are both vibrations. Noise is a vibration that we can hear, whilst “vibration” we feel.
How are Noise and Vibration Measured?
Monitoring equipment is used to record sound levels. A microphone is used and any sound is recorded and the “volume” recorded. The results are recorded in decibels (dB). Vibration is measured using an accelerometer. This measures movement in 3 different directions (up-down, side to side and forward-backwards). Results are presented in mm/s that is a measure of movement over time.
 For people there is no limit as such, although 10mm/s is thought to
be “intolerable”. However, humans all differ and some may tolerate more
vibration, and some less. We would typically consider a vibration level
of 5 mm/s as a trigger level where residents should be protected. For a
building the trigger levels differ depending on the strength of the
building. But past 15mm/s investigations should be made, to try and
reduce vibrations affecting the building.
For people there is no limit as such, although 10mm/s is thought to
be “intolerable”. However, humans all differ and some may tolerate more
vibration, and some less. We would typically consider a vibration level
of 5 mm/s as a trigger level where residents should be protected. For a
building the trigger levels differ depending on the strength of the
building. But past 15mm/s investigations should be made, to try and
reduce vibrations affecting the building.
Noise limits are different to vibration in that there is normally background noise, which louder noises have to overcome in order to be a nuisance. For example talking loudly in a quiet library will disturb people nearby, whilst talking loudly at a football match; you may not even be heard. With noise we typically measure a back ground (or baseline) level and then add 5dB on top of this to give a Trigger level.
The travel path is the path the sound takes from the source (digger) to the receiver (ear). Outdoor barriers can block travel paths, for example traffic noise. The effectiveness of barriers is dependent on factors such as its distance from the noise source and the receiver, its height and construction.
Secondary
data collected in the Kings Cross Station EIS (London), indicates
Basic Noise Level, dB LA10, 1hr
of 73.5 dBA on Camden Road, the report
includes monitoring locations in 16 other locations between the site and Kings
Cross Station. Noise levels range from 68.7 dBA to 76.7. A US90 certainty value
for this data set is 74.22 dBA.
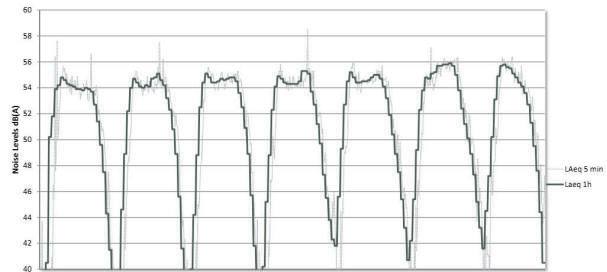
The LA90
15min sound level on Bayham Place (to the rear of Camden High Street, London )
was calculated at 54dBA. Which is noted being representative of "night time back
ground sound level". This sound level has been adopted as a worst case to assess
impact of heat pump units on nearest noise sensitive windows.
Observing
daytime levels from we can see LAeq Levels of 65dBA. The LA90 15min level peaks
at 58dBA.
Many have tried to explain noise level simply, but many are too clever to do this. The main two expressions of noise used in reports that you may read on planning websites for example are LA90 and LA10, they can be both recorded at the same time with the same equipment yet they give different values, why is this?
Step 1 - First of all we measure the noise using a noise meter. So we might have data that looks like this: 70, 75, 72, 74, 70, each number is the average noise level for a time period perhaps 1 minute. For a 24 hour period we would have approx. 3600 numbers in a row.
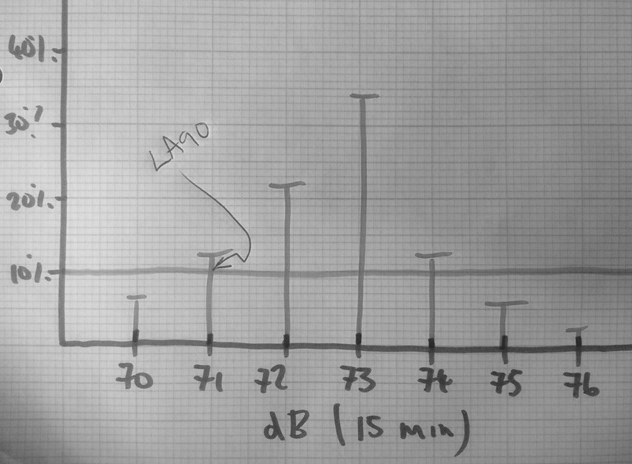 We can then make a graph using these numbers, a histogram to be
precise, where we label the noise levels along the x (bottom) axis and
noise level on vertical (y) axis. We end up with something that looks
like the chart to the right.
We can then make a graph using these numbers, a histogram to be
precise, where we label the noise levels along the x (bottom) axis and
noise level on vertical (y) axis. We end up with something that looks
like the chart to the right.
We gather up our number that we have recorded and group them together in
"bins" of whole number noise levels, that increase incrementally. We
then make of histogram to show what percentage of of measurements are
made up by each of these "bins".
The first bar from left to right that passes 90% is 71, that is our LA90
Level. We can see it is quite low and as such represents back ground
noises, it is a good value to use for "base level" noise.
The first bar to pass 10% from right to left is 74, that is our LA10
Level as you can see it represents all of the louder noises that we
might be subject o of the course of a day, it is quite useful for
describing how annoying noise might be.
So you can now see that a LA90 shows noises as a bit quieter than they
might be. But both do not tell you how loud the loudest noises are, as
you can see from the graph some noises might be 76dB but using LA90 and
LA10 you would not know that.
For developments involving significant demolition or earthworks, we provide assessments in accordance with BS 5228-1:2009+A1:2014 (Code of practice for noise and vibration control on construction and open sites). This framework allows us to predict noise levels from various plant items and activities, ensuring that mitigation measures are integrated into a Construction Environmental Management Plan (CEMP). By applying these standards, we help developers minimize community disturbance and meet the stringent requirements often set by local authorities under Section 61 of the Control of Pollution Act.
When assessing the impact of new roads or the effect of increased traffic volume on existing noise-sensitive receptors, we utilize the CRTN (Calculation of Road Traffic Noise) methodology. This industry-standard approach, published by the Department of Transport, allows for the precise modeling of L10,18h noise levels based on traffic flow, speed, and heavy vehicle percentages. Using CRTN ensures that our Noise Impact Assessments provide a robust evidence base for planning applications, particularly when demonstrating compliance with the Noise Policy Statement for England (NPSE).
Noise Assessment (Camden, London) - Night Club Noise Assessment
Noise & Vibration Monitoring ( Horsham, West Sussex) - Noise Assessment for Demolition Activities
Noise Impact Assessment (Grays, Essex) - For Self Storage Warehouse Project
“Default Yes” Housebuilding Near Train Stations - Noise Impact Assessment Near Train Stations
The below section was written by a machine.
A comprehensive Noise Impact Assessment is a fundamental pillar of any large-scale Environmental Impact Assessment (EIA). As urban density increases, the acoustic relationship between industrial sources and noise-sensitive receptors becomes more complex. Regulatory scrutiny now demands precise evidence-based modeling to ensure that developments comply with the Noise Policy Statement for England (NPSE) and specific local planning policies, such as the London Air Quality Neutral and noise standards.
Modern noise assessments rely on sophisticated impact prediction tools to derive post-development figures. These models account for the 3D geometry of the site, including barriers, topography, and building facades that may attenuate or reflect sound energy.
Beyond audible sound, ground-borne vibration presents distinct risks to both human comfort and building stability. This is particularly relevant during the construction phase of projects involving heavy earthworks or piling.
Integrating noise data with broader site documentation—such as Sustainability Statements and Planning Statements—provides a streamlined route to consent. At SWEL, we combine over 15 years of industry experience with a deep understanding of UK legislative requirements (such as BS 5228 and CRTN) to deliver authoritative assessments. With 900+ projects completed nationwide, our technical expertise ensures your development meets the highest standards of environmental compliance and acoustic design.