Great Crested Newt District Level Licensing – South Gloucestershire
Building your own home is an exciting milestone, but the planning process can sometimes unearth unexpected challenges, especially when local wildlife is involved. We recently had the pleasure of supporting a client with their application to erect a single self-build dwelling. The project, beautifully situated in the South West, is a perfect example of how early ecological consultation can keep your development on track.
The Challenge: Nearby Habitats
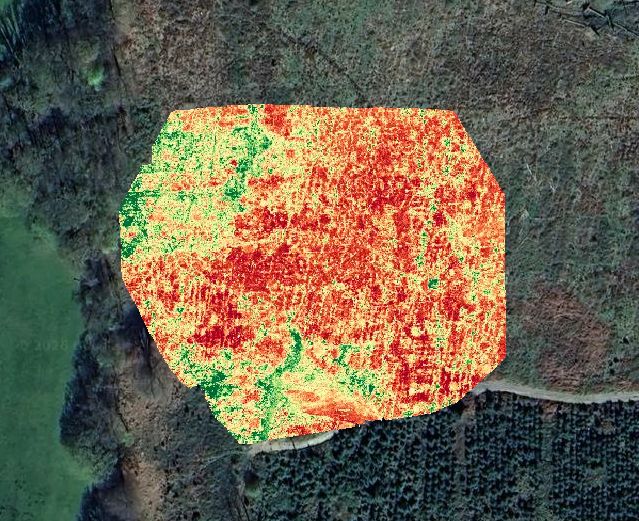
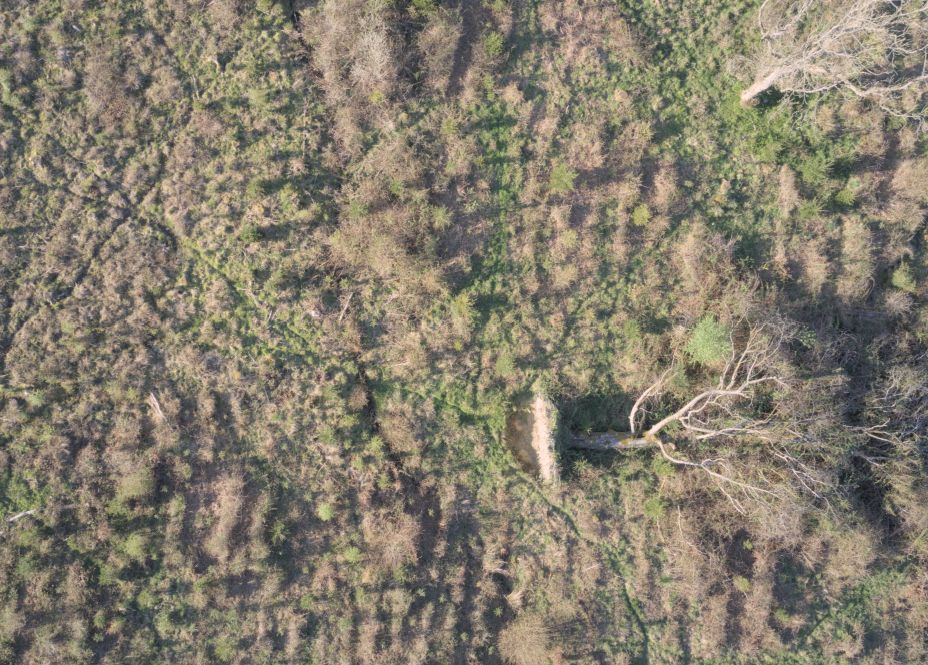
When embarking on a new build, assessing the surrounding environment is a critical first step. While there were no waterbodies directly within our client’s site boundary , our assessments identified three ponds within a 250-metre radius. Because the Great Crested Newt (GCN) is a European protected species , strict regulations apply to developments that could disturb them or damage their resting places. Even if the newts aren’t directly on your footprint, nearby ponds often mean you need an official strategy to proceed.
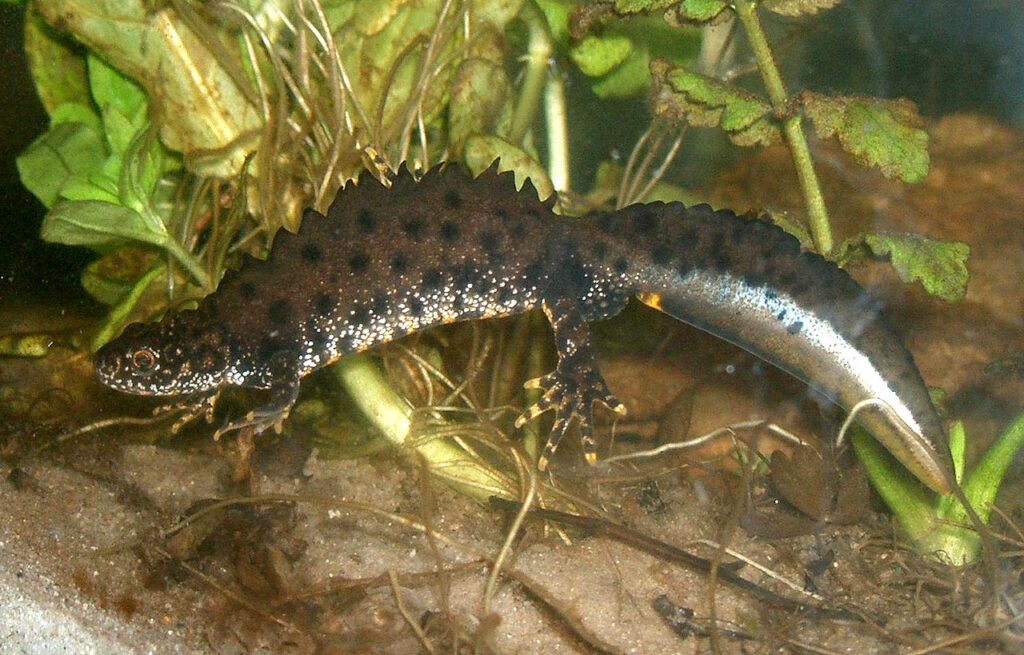
Great Crested Newt – Rainer Theuer
The Solution: District Level Licensing (DLL)
To ensure the project could move forward without delays, we acted as the lead ecological consultants to manage the Great Crested Newt District Level Licensing (DLL) process. District Level Licensing is a fantastic route operated by Natural England that often provides a quicker, more streamlined alternative to traditional mitigation licenses. Here is how we delivered for our client:
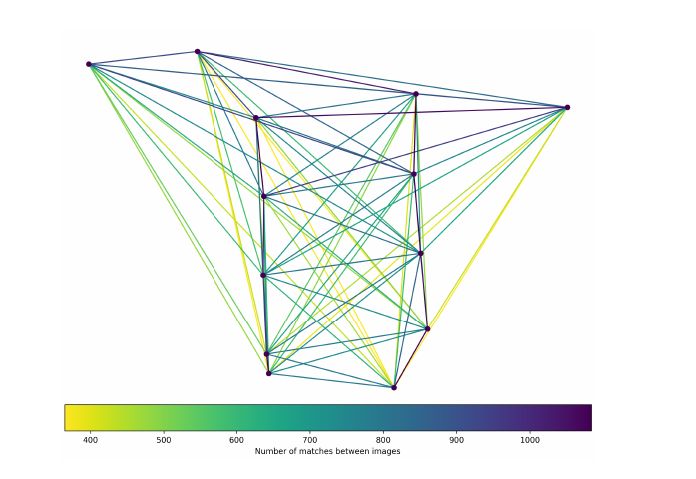
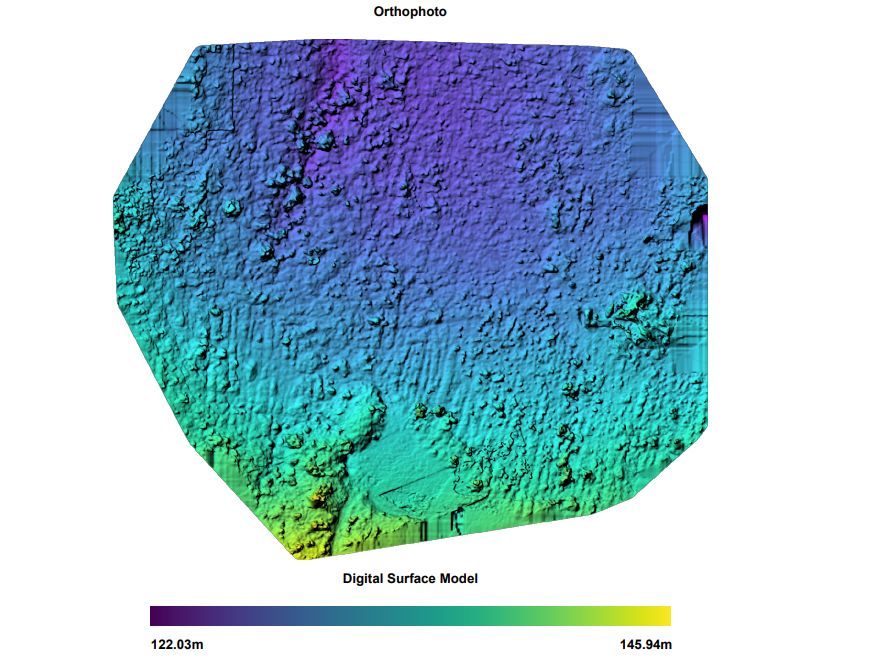
First, we managed the necessary ecological assessments, including eDNA surveys to accurately determine the presence or absence of GCNs in the area. Second, we handled the complex DLL enquiry process from start to finish, meticulously compiling site data and mapping the required GIS polygon shapefiles. Finally, by acting as the primary agent, we ensured all documentation was fully complete and accurate, aligning the proposed construction timescales with the licensing requirements.
Keeping Your Project Moving
Because we handled the technical intricacies of the wildlife legislation, our client was able to submit their planning consent with the confidence that the licensing requirements were fully under control.
Do you need help with a GCN DLL Enquiry?
Whether you are planning a small private development or a large-scale project, navigating protected species legislation doesn’t have to be a roadblock. Our team of expert ecologists is here to guide you through the District Level Licensing process quickly and efficiently. Contact us today to discuss your site and find out how we can help you achieve your development goals while supporting local biodiversity.