Category Archives: Drone Survey

Ecological Drone Survey Services: Applications of RGB Photogrammetry

Drone Surveys for Ecological Purposes

Through the application of photogrammetry and post-processing software, this standard imagery can be converted into measurable, actionable data for ecological assessment.

Below is an overview of the ecological drone survey services we offer, utilizing RGB cameras and advanced data interpretation techniques.

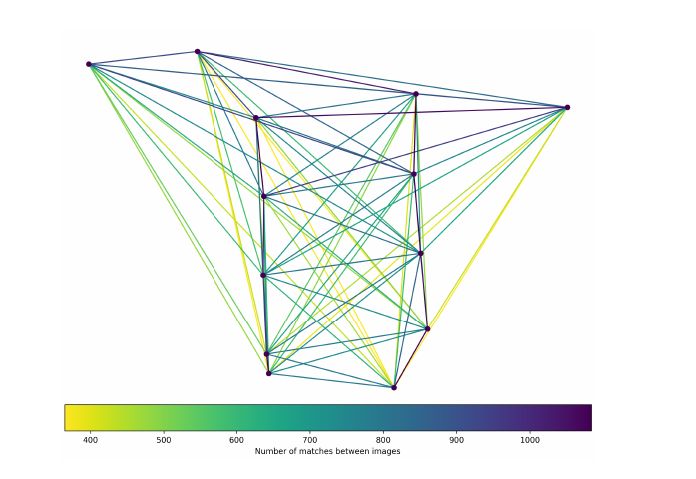
Drone Data Collection Planning

Habitat Mapping and Land Cover Classification Surveys

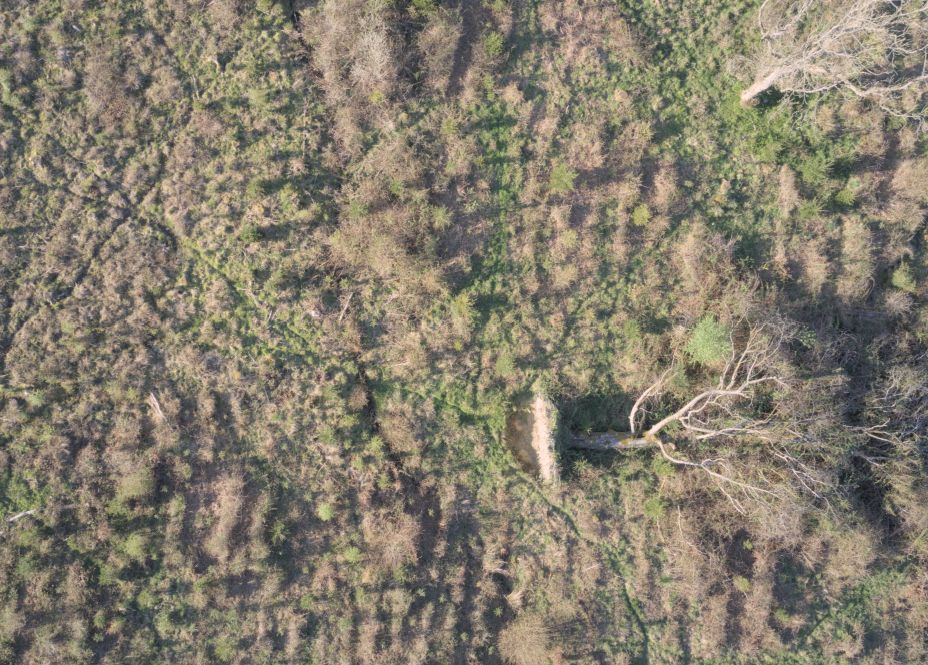
Our habitat mapping surveys generate high-resolution orthomosaics—distortion-free maps created by stitching together overlapping aerial photographs. These outputs provide a precise top-down view of the survey area.

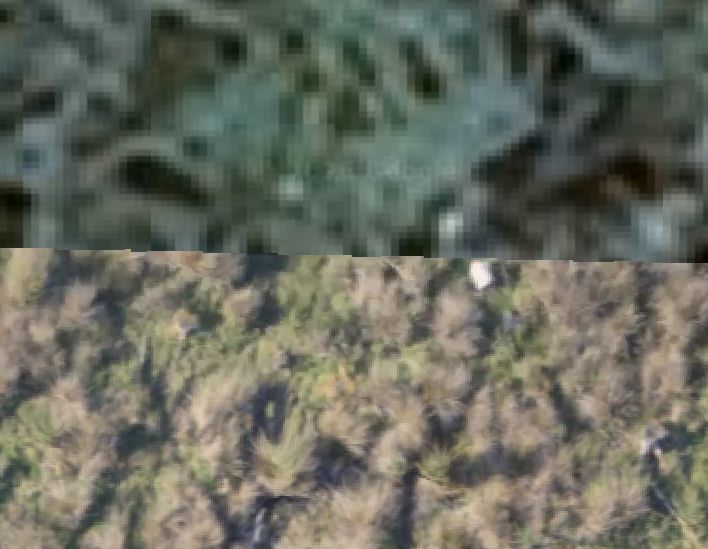
  • Micro-Habitat Delineation: We map distinct vegetation zones, wetland boundaries, and transition areas (ecotones) at a centimeter-level resolution, providing greater detail than standard satellite imagery.

  • Invasive Species Identification: High-resolution RGB imagery allows for the visual identification and mapping of specific invasive plant species based on their distinct coloration or flowering periods.

  • Habitat Fragmentation Analysis: The data allows for the measurement of distances between habitat patches, the length of edge habitats, and the assessment of wildlife corridor connectivity.

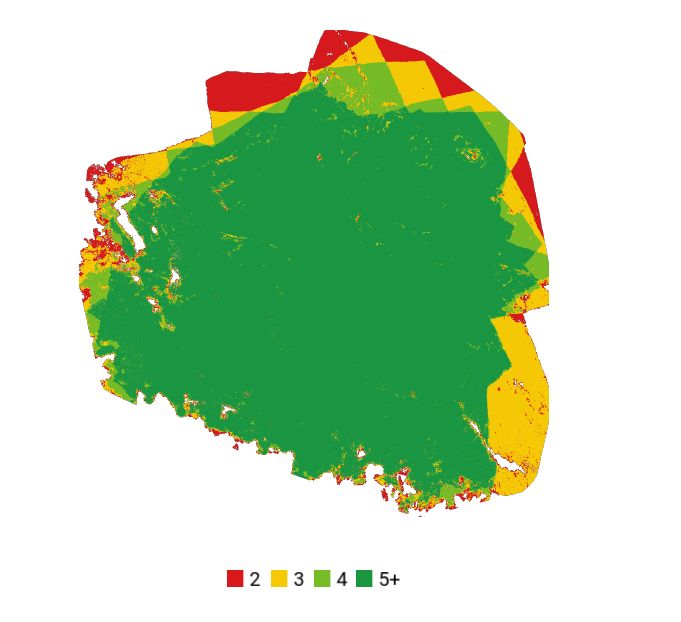
3D Topographical and Structural Surveys

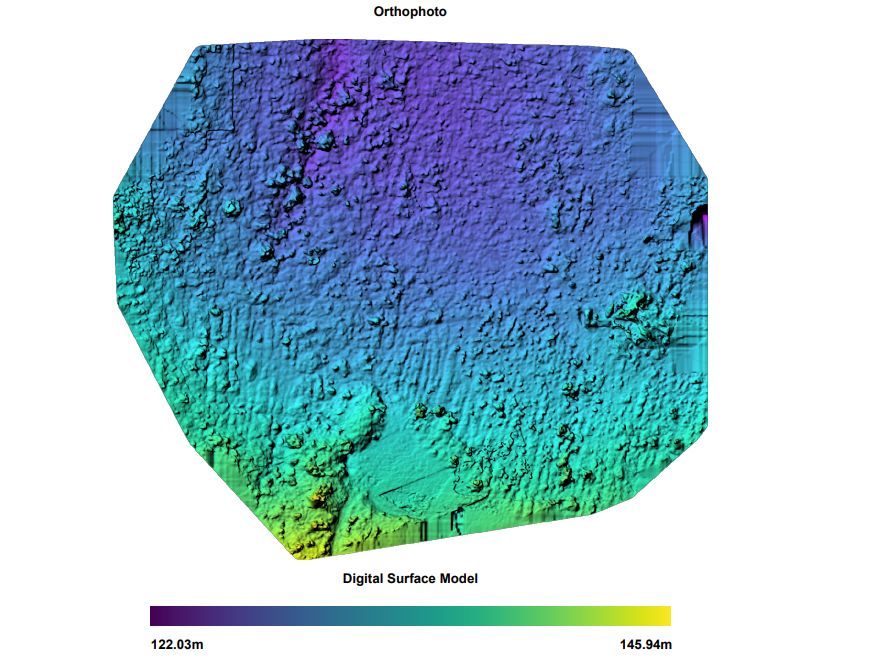
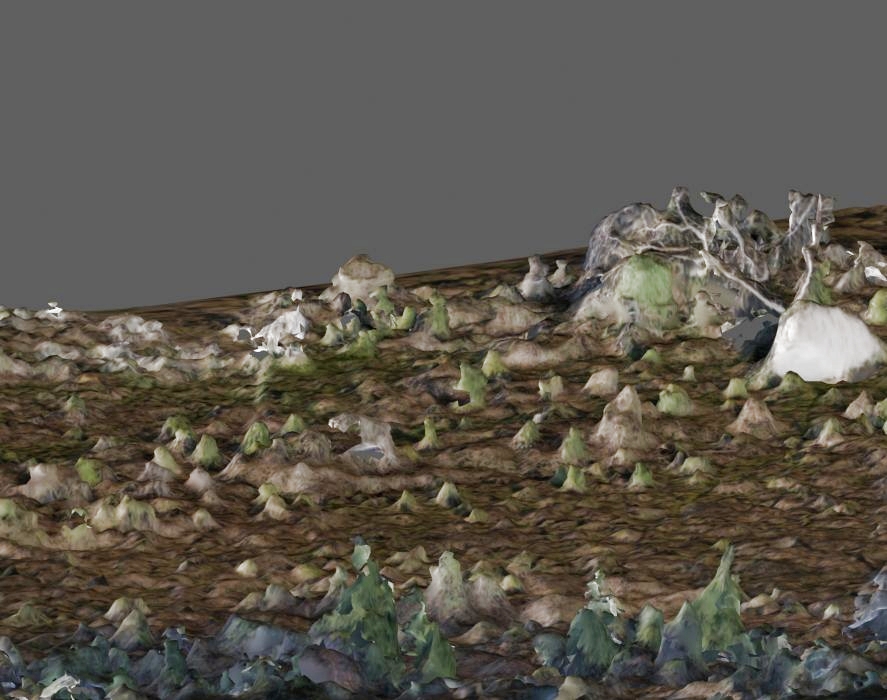
Using Structure from Motion (SfM) software, we process 2D images to construct accurate 3D models of the ecosystem, allowing for the analysis of physical vegetation structure and ground topography.

  • Canopy Height Models (CHM): By generating a Digital Surface Model (DSM, representing the top of the vegetation canopy) and a Digital Terrain Model (DTM, representing the bare ground), we can calculate the specific height of forest or scrub canopies.

  • Biomass and Carbon Estimation: Structural metrics derived from our 3D models can be correlated with ground-truthed data to support the estimation of above-ground biomass and carbon storage.

  • Hydrology and Geomorphology Mapping: DTMs allow for the modeling of surface water flow, the identification of pooling areas in wetland ecosystems, and the measurement of coastal or riverbank erosion over time.

Vegetation Health Assessments (RGB Indices)

While Near-Infrared sensors are standard for certain health metrics, vegetation vigor can still be estimated using purely RGB data through mathematical manipulation of the red, green, and blue pixels.

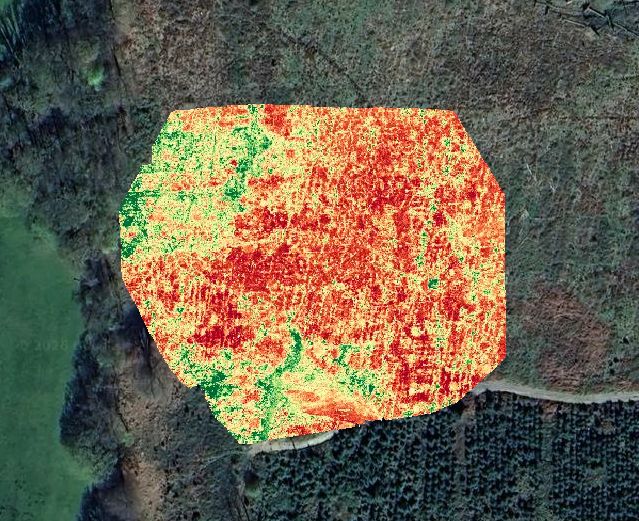
RGB Data Interpretation

  • Visible Atmospherically Resistant Index (VARI): We utilize VARI to assess canopy cover and relative plant health. This index measures the greenness of an area while minimizing atmospheric effects.

  • Phenology Monitoring: Through repeated surveys, we can map seasonal changes such as spring leaf-out or autumn senescence, providing data on phenological shifts and climatic impacts on local vegetation.

Wildlife Population Surveys

Standard RGB drone imagery is an effective method for direct population counts, particularly in areas that are difficult to access on foot.

  • Colony Counting: We conduct high-altitude orthomosaic surveys to capture nesting bird colonies or resting marine mammal populations. This method minimizes the disturbance associated with ground surveys or low-flying crewed aircraft.

  • Automated Detection: Orthomosaic outputs can be integrated with AI and Machine Learning models to facilitate the automated detection and counting of specific animal species across large survey areas.

Habitat Condition Survey

Temporal Change Detection and Monitoring

We offer repeatable survey programs to monitor changes in a specific landscape over time.

  • Restoration Monitoring: For sites undergoing rewilding, peatland restoration, or afforestation, we conduct automated grid flights at regular intervals (e.g., bi-annually). By analyzing the resulting orthomosaics and 3D models chronologically, we provide quantifiable data on landscape recovery and structural changes.

Photogrammetry Work Flow – Linux: Step by Step

Drone Surveys in the Environmental Consultancy Sector

In the commercial sector, consultancies rely heavily on accurate topographical models and 3D visualizations to conduct Landscape and Visual Impact Assessments (LVIA)—such as modeling the visual footprint of proposed wind turbines—or to establish accurate site baselines for Preliminary Ecological Assessments.

The processing was conducted entirely on open-source Linux software. The hardware utilized was a Lubuntu workstation equipped with an Intel Core i9, an NVMe SSD, and 16GB of RAM. While the processor and storage speeds were more than adequate, the 16GB memory capacity required some careful resource management during the heavier processing phases.

44 images like this one used to create mesh (the fallen tree is a good reference point)

Phase 1: Flight Planning and Data Acquisition

A 2D flight grid was plotted using a web-based mission planner (Drone Grid), and the resulting CSV was imported into Litchi to run on the drone controller.

Rather than relying on automated distance-based photo triggers—which can occasionally misfire or skip photos during curved maneuvers—a manual interval approach was utilized (Litchi). The drone was placed in a hover, the camera was set to a 2-second interval, and the shutter was manually engaged before initiating the mission. This ensured a continuous, reliable stream of overlapping images as the drone navigated the grid.

Phase 2: Dataset Culling and Format Conversion

Once the flight was completed, a quality control check was performed on the dataset. Any extraneous photos captured during takeoff, landing, or non-nadir (not pointing straight down) turns were removed, as these irregular angles can confuse the photogrammetry software and corrupt the final geometry.

Initially, the drone was set to capture RAW (.DNG) files. While RAW formats are excellent for standard photography, they lack the automated lens-flattening corrections applied to DJI’s JPEGs. Furthermore, uncompressed RAW files are heavily taxing on system memory during 3D processing.

To rectify this, the DNGs were imported into darktable on Linux. A batch lens correction profile was applied to eliminate the fish-eye distortion, and the dataset was exported as high-quality JPEGs. (Note: moving forward, capturing JPEGs natively on the drone is highly recommended to bypass this conversion step entirely).

Phase 3: Processing in WebODM

WebODM (OpenDroneMap), deployed via Docker, was used for the photogrammetry processing.

The 3D texturing phase of photogrammetry is notoriously memory-intensive, and the 16GB of system RAM was quickly identified as a bottleneck. To prevent Docker from running out of memory and crashing the process, the Resize Images parameter within WebODM’s settings was capped at 2048. This significantly reduced the memory footprint during the dense point cloud and meshing phases, allowing the i9 processor to complete the job smoothly while leveraging the fast swap/read speeds of the NVMe drive.

Top Google Satellite Image / Bottom Ortho Mesh Photo Output from WebOMD

Phase 4: Output Visualization

Once the processing concluded, the 2D orthomosaic was reviewed directly within the WebODM web interface. The software successfully stitched the dataset into a crisp, seamless top-down map, providing an excellent baseline of the site.

DSM From Drone Data

Viewing the 3D output required a slight workaround. Rendering a massive, fully-textured 3D mesh directly in the browser via WebGL can sometimes cause instability depending on Linux graphics drivers. Instead, the .obj file and its associated texture map were downloaded and opened natively in Blender.

Because 3D software often disagrees on coordinate systems, the mesh imported on its side. This was quickly corrected by rotating the model 90 degrees on the X-axis. Once the material preview was enabled, the high-resolution texture map was projected onto the geometry, yielding a mathematically accurate, true-to-life 3D representation of the area.

3D Mesh Image (Note the white shape to the top right is root ball of fallen tree)

Conclusion

By effectively managing hardware limits and ensuring the dataset is properly formatted, commercial-tier photogrammetry can be reliably executed on a standard Linux workstation. The resulting 2D and 3D outputs now serve as a foundational geospatial baseline.