BNG Small Sites Exemption and the £300k Priority Habitat Trap

The BNG Small Sites Exemption and the £300k Priority Habitat Trap (August 2026 Update)

As of August 6, 2026, the latest package of mandatory Biodiversity Net Gain (BNG) rules has officially landed. For developers dealing with smaller plots, there is some good news—but it comes with a massive, potentially project-ruining catch if you don’t know what you are looking for on your land.

Here is a practical breakdown of the new exemptions, why you can’t rely purely on desktop maps, and why clearing a site before getting an ecologist out could cost you hundreds of thousands of pounds.

A four-to-five-story dark gray and cream building on a hill crest in Plymouth, viewed across a foreground of dense scrub, young trees, and partially hidden temporary marquee structures under a flat white sky.

A hilltop educational or office building in Plymouth, standing beyond an overgrown area of scrubland and temporary canvas structures. Image: Alex McGregor CCL

The New Exemptions (As of August 2026)

If your planning application was submitted on or after August 6, 2026, the following updates apply:

  • The Small Sites Rule: Developments with a red line boundary of 0.2 hectares (2,000 sqm) or less are now exempt from mandatory BNG.
  • Temporary Developments: Fully temporary projects with planning permission for 5 years or less are exempt.
  • Self-Builds: The previous exemption for self-build and custom housebuilding has been removed. These must now deliver BNG (though many single dwellings will naturally slip under the new 0.2ha threshold).
  • The “De Minimis” Rule: This remains in place, exempting sites that impact less than 25m² of habitat or less than 5m of linear habitat (like hedgerows).

Seems straightforward, right? If you have a 0.15-hectare plot, you’re exempt.

Wrong. There is a major caveat: The small site exemption is immediately voided if the development negatively impacts a UK Priority Habitat.

What is a Priority Habitat?

Priority habitats are ecologically valuable areas protected under the NERC Act 2006. If your site has one, you are disqualified from the small-site exemption. You will need a full biodiversity metric and a bespoke compensation plan.

The three most common priority habitats that catch developers out are:

  • Species-Rich Hedgerows: Not your standard hawthorn boundary. If a hedge has five or more native woody species per 30 metres, it’s a priority habitat.
  • Lowland Mixed Deciduous Woodland: This covers most native, broadleaved woods in the UK.
  • Lowland Meadows: Unimproved, flower-rich grasslands that haven’t been heavily fertilized.

“But it’s not on Magic Map!”

Many developers check DEFRA’s Magic Map, see a blank space over their site, and assume they are clear. This is a dangerous mistake.

Magic Map’s Priority Habitat Inventory is just a desktop tool based on historical data. It frequently misses small woodland copses, edges, or newly matured areas that haven’t been formally surveyed.

For planning and BNG purposes, the local planning authority (LPA) only cares about the ecological reality on the ground today. If your ecologist surveys the site and finds the woodland meets priority criteria, the LPA will legally treat it as priority habitat—regardless of what Magic Map says.

The Pre-emptive Clearance Disaster

Let’s look at a worst-case scenario. Say a developer has a 0.2-hectare site. They check Magic Map, see nothing, and send in the chainsaws to clear a patch of unmanaged trees before putting in planning, assuming they’ll use the small-site exemption.

Later, the LPA asks for an ecological report, and it transpires the cleared trees were actually a priority deciduous woodland.

Here is exactly what happens next under the Environment Act 2021:

1. The “Precautionary Baseline” Penalty You cannot “clear the slate” to bypass BNG. If habitat was cleared after January 30, 2020, the LPA must assess the site based on its condition prior to clearance. Because the physical evidence is gone, the LPA will legally apply a “precautionary approach,” assuming the highest possible distinctiveness and condition for that woodland.

2. The Exemption is Voided Because it was priority woodland, the 0.2ha exemption is thrown out. The developer must deliver a full 10% net gain.

3. The Crushing Financial Cost Let’s run the math on 0.2 hectares of “High Distinctiveness / Good Condition” woodland.

  • It generates roughly 3.6 baseline units.

  • Add the 10% mandatory gain = ~4 units required.

Because the site is now covered in concrete, the developer must buy those 4 units completely off-site.

  • Private Market: High-distinctiveness woodland units currently trade for around £60,000 each. That’s a £240,000 bill.

  • Statutory Credits: If private units aren’t available, you are forced to buy Government Statutory Credits at a penalizing 2:1 ratio. At £48,000 per Tier A2 credit, you need 8 credits. Your final bill? £384,000.

The Takeaway

The BNG rules are designed with heavy punitive measures for habitat clearance. Attempting to bypass the system by clearing a site without professional advice can easily turn an exempt, straightforward build into a six-figure legal and financial nightmare.

Always get an ecologist on site before you touch a single branch.

If you need help navigating the latest BNG exemptions, establishing your baseline, or ensuring your planning application is bulletproof, get in touch with our team today.

Environmental Noise Monitoring for Commercial Plant Operations in London

Environmental Noise Monitoring for Commercial Plant Operations in London

Project Overview and Location

Southwest Environmental Limited was recently commissioned to undertake an environmental noise monitoring project at a residential boundary in London, Greater London. The location falls under the planning jurisdiction of the London Borough of Merton. The primary objective of this instruction was to record and quantify noise levels associated with large-scale plant equipment situated at a major tennis club in the area. Specifically, the noise sources under investigation included a chiller plant, a centralized building, and broadcast facilities. The monitoring was initiated following reports that operational noise persisted continuously throughout the daytime and nighttime periods.

Acoustic Monitoring Methodology

To acquire accurate and representative acoustic data, Southwest Environmental Limited deployed a Svantek SV 307A monitoring station. The sound level meter was installed securely at the residential receptor site and was programmed to log data continuously over a designated five-day period. The scope of the monitoring recorded hourly intervals to establish a precise timeline of the ambient and operational noise climate.

The acoustic parameters measured were A-weighted to adjust the measurements to match human perceived noise levels. The primary metrics utilized in this assessment were:

  • LAeq: The A-weighted, equivalent continuous sound level, which calculates the average noise energy over a specific time period.
  • LA(90): The A-weighted sound level that is exceeded for 90% of the measurement duration. This parameter is the standard metric used to establish the underlying background sound level at a receptor.

Regulatory Standards and Assessment Criteria

The collection of LAeq and LA(90) data is fundamentally required for the assessment of commercial and industrial noise sources. The methodology applied during data acquisition aligns with the requirements of BS 4142: Method for Rating and Assessing Industrial and Commercial Sound. This standard dictates how background sound should be measured and compared against the specific sound level of the commercial operation to determine the likelihood of adverse impacts.

Our data processing categorized the continuous logging into specific reference periods, calculating the average sound levels for the daytime (08:00 – 17:00), evening (18:00 – 23:00), and nighttime (00:00 – 07:00) hours. This temporal breakdown is essential for conducting a robust BS 4142 assessment, as the sensitivity of residential receptors varies significantly between day and night. For more information on how we conduct these surveys, please visit the environmental services section on the Southwest Environmental Limited website.

Project Delivery

Environmental sound assessments often require prompt action to capture representative data during specific operational periods. For this project, Southwest Environmental Limited executed a rapid turnaround. We prioritized a short lead time for site mobilization, equipment installation, and the subsequent compilation of the acoustic data into a structured summary report.

Please contact us if you would like a fixed price quotation.

Preliminary Ecological Appraisal – Yeovil, Somerset

Preliminary Ecological Appraisal for Proposed Agricultural Development in Somerset

Southwest Environmental Limited recently prepared a Preliminary Ecological Appraisal (PEA) report for a surveying firm in Yeovil, Somerset. The site is positioned within the planning jurisdiction of South Somerset District Council. The appraisal was commissioned in connection with the proposed development of a single farmworker’s dwelling and an associated parking area. Our team completed the necessary ecological surveying and reporting with a rapid turnaround.

Methodology and Scope of Works

The ecological appraisal was conducted in strict accordance with industry standards, incorporating the CIEEM Guidelines for Ecological Impact Assessment (2024). The assessment commenced with a desktop study to identify statutory designated sites, local habitats, and geo-spatially tagged species within the site’s zone of influence. The site is located inside the Site of Special Scientific Interest (SSSI) Impact Risk Zones of Influence for multiple biological sites, including Grove Farm and Whitevine Meadows. The desktop phase also verified that the site is located 1,155 metres north of the Dorset National Landscape, an Area of Outstanding Natural Beauty. Following the desktop review, a Phase 1 habitat survey was executed to classify and map the habitats present, adhering to the standard UK Habitat Classification (UKHab) system. Further details regarding our ecological assessments can be found on the Southwest Environmental Limited ecology page.

Habitat Classification and Species Assessment

The surveyed site predominantly consists of modified grassland, covering approximately 1,618 square metres, and is characterised by a short sward dominated by perennial ryegrass. The eastern and southern boundaries contain continuous sections of mixed scrub, measuring approximately 182 square metres, comprising species such as bramble, common nettle, field elm, and elder.

During the field survey, the site was systematically evaluated for its potential to support species protected under national legislation, including the Wildlife and Countryside Act 1981 (as amended), the Conservation of Habitats and Species Regulations 2017 (as amended), and the Natural Environment and Rural Communities (NERC) Act 2006. The assessment concluded that the mixed scrub boundaries offer suitable nesting habitat for common and widespread bird species Additionally, the site provides potential foraging and commuting habitats for mammals, such as hedgehogs, and various terrestrial invertebrates. The preliminary protected species assessment also investigated the potential for roosting bats; however, the absence of onsite trees, buildings, and suitable roosting features led to a low likelihood of roosting bats being present. Similarly, the site offers sub-optimal terrestrial habitat for great crested newts due to the lack of dense tussocky cover and aquatic breeding features.

Conclusions and Site Enhancements

The overall nature conservation value of the site was determined to be low. The proposed residential development is anticipated to have a minimal ecological impact, provided that specific precautionary mitigation measures are implemented prior to and during construction. These essential measures include the directional mowing of grassland to displace any potential reptiles and the scheduling of scrub clearance outside of the active bird nesting season, which typically occurs from March to September inclusive. Consequently, no further Phase 2 species-specific surveys were deemed necessary for this project.

The development presents actionable opportunities to enhance the site’s biodiversity. Recommendations include native hedgerow planting, the creation of log piles, the installation of bat and bird boxes, and the incorporation of permeable boundaries featuring hedgehog gaps in new fencing.

Please contact us if you would like a fixed price quotation.

Lighting Assessment for Residential Development Near Woodland Habitat

Lighting Assessment for Residential Development Near Woodland Habitat

Southwest Environmental Limited was recently instructed by an architectural firm to produce a Lighting Assessment for a proposed residential development. The site is located in Buckland Ripers, Dorset, and falls within the planning jurisdiction of Dorset Council.

The Development

The proposed development comprises the construction of a single residential dwelling, a garage, and an associated garden. Environmental constraints were a primary consideration for this site. The location is situated 1.6 kilometres from the Dorset National Landscape Area of Outstanding Natural Beauty (AONB). Furthermore, a woodland area is located just over 20 metres to the south of the proposed dwelling. Ecological surveys previously conducted at the site identified the presence of Myotis bats within this woodland. Myotis bats are known to be highly sensitive to artificial light, necessitating careful planning and mitigation.

Objectives

The objective of our Lighting Assessment was to design a lighting scheme that meets the safety and operational requirements of the future human occupants while preventing light spill that could negatively impact the adjacent bat habitat. The assessment was conducted in accordance with relevant legislation, including the Planning (Clean Neighbourhoods and Environment) Act 2005, and national planning policies which require new developments to limit the impact of light pollution on nature conservation.

To achieve the necessary control over light emission, we developed a strategy adhering to the guidelines set out by the Institute of Lighting Professionals and the Bat Conservation Trust. External lighting is restricted to narrow-beam, horizontal cut-off LED downlighters mounted at low elevations, specifically 0.6 metres and 1.6 metres above ground level. These luminaires will be fitted with passive infrared (PIR) and dawn-to-dusk sensors to ensure they are only active when required. We specified a warm colour temperature range of 2700k to 3000k to minimise the ultraviolet light output, which is known to attract insects and disrupt bat foraging patterns. Up-lighting was strictly prohibited across the entire site.

A bright, modern lecture space with large windows and colorful blue, yellow, and red tiered seating.

A Well Lit Space

Internal light spill was also evaluated as a critical factor due to the proximity of the southern woodland. To address this, the design incorporates electrochromic glass on the windows of the front entrance. This dynamic glazing activates when internal lighting is switched on, providing up to a 90 percent reduction in visible light transmission through the glass.

Method & Outcome

We utilised lighting design software to model the proposed external and internal lighting, producing lux contour plans for both horizontal and vertical planes. The quantitative analysis demonstrated that horizontal light spill on the ground would remain below 0.5 lux around the immediate development, dropping below 0.2 lux well before reaching the woodland edge. Vertical luminance along the woodland boundary was also shown to be predominantly below 0.2 lux, ensuring the bat habitat remains sufficiently dark. Construction phase mitigation measures were also detailed to prevent temporary light spill during the build.

This comprehensive analysis and the accompanying mitigation strategy were completed with a short lead time to assist the client in maintaining their planning submission schedule.

Please contact us if you would like a fixed price quotation.

Louder Cooling Systems Owing To Climate Change

The Hidden Sound of Climate Change: Why Our Cooling Systems are Getting Louder

When we talk about the impacts of climate change, the conversation naturally gravitates toward rising temperatures, extreme weather, and shifting ecosystems. But there is another, far less discussed side effect of a warming world: it is getting significantly louder.

As global temperatures and humidity levels rise, our reliance on air conditioning and heavy refrigeration systems is skyrocketing. To see this in action, we only need to look at a recent noise monitoring project we were commissioned to undertake.

A diagonal shot of three heat pumps, each with two vertically stacked fans, mounted on a tubular steel base on a flat surface. White tubing emerges from the back of the closest unit. Behind the pumps, galvanized brackets secure cables and pipes to a tall white wall, and a multi-paned black window glows with yellow light from inside the building.

Large AC Unit

The Case Study: A Large Sports Facility in Wimbledon

We were recently called in to assist a local residents’ group living in the shadow of a large, well-known sports facility in Wimbledon. Their complaint is becoming increasingly common in urban and suburban areas: the mechanical hum of the facility’s air conditioning and refrigeration units has become unbearable.

The worst of the noise pollution seems to occur during major events, particularly when the stadium’s roof is closed, forcing the environmental control systems to work at maximum capacity to keep spectators comfortable. Even more frustrating for the locals is that these cooling systems are now occasionally running well past their standard 11 PM curfew.

To investigate, our team is deploying remote noise monitors in the back gardens of affected homes to capture real-world data over a couple of weeks. By comparing these live running noise levels against the facility’s original baseline noise report and planning permission limits, we can determine exactly how much the acoustic environment has degraded.

Why is the Noise Getting Worse?

According to the residents, when this cooling equipment was first installed roughly 10 to 15 years ago, the noise was noticeable but manageable. Today, it feels constant. While aging equipment and routine maintenance factors certainly play a role, the changing climate is the primary driver.

Here is exactly how shifting weather patterns are turning up the volume on local infrastructure:

  • Hotter, More Humid Days: Anecdotally (though supported by meteorological trends), the nature of our summer heat is changing. We aren’t just seeing higher peak temperatures; we are experiencing intense, sticky humidity that we haven’t historically dealt with in the UK. Cooling systems have to work much harder to strip moisture from the air, meaning fans and compressors are running at full tilt more consistently than they were designed to a decade ago.

  • Warmer Nights: The residents noted that the AC systems are running much later into the night. Because overnight temperatures are failing to drop to historical averages, facilities can no longer rely on natural nighttime cooling. Mechanical systems are forced to bridge the gap, running deep into the night and breaching traditional noise curfews.

  • The “Greenhouse” Effect of Enclosed Stadiums: When facilities close their roofs to protect events from unpredictable weather, they inadvertently trap heat and humidity. Blasting the AC to compensate creates an acoustic double-whammy: the systems work harder, and the noise generated is often pushed outwards toward the surrounding neighborhoods.

The Acoustic Reality: We are currently relying on mechanical infrastructure designed for the climate of 2010 to handle the extreme weather of today. The result is overworked machinery, higher energy consumption, and a lot more noise.

Planning for a Louder Future

This project in Wimbledon highlights a growing challenge for environmental acoustic consultants, urban planners, and local councils.

When large commercial facilities conduct their initial noise impact assessments, the baselines are calculated using historical climate data. If a system only needed to run at 50% capacity for a few weeks a year when it was installed, its acoustic footprint was likely deemed acceptable. But when that same system is forced to run at 90% capacity for months on end—and late into the night—those original noise limits are easily shattered.

As we continue to adapt to hotter summers, we must ensure that our noise regulations and equipment standards adapt alongside them. Otherwise, we risk trading the discomfort of the heat for the exhaustion of sleepless, noisy nights.

Here is an additional section you can slot right into the blog post, perhaps just before the concluding “Planning for a Louder Future” section:

The Crucial Role of the “+5 Decibel” Planning Condition

When investigating noise complaints like the one in Wimbledon, our primary point of reference is the facility’s original planning permission. One of the most important tools local councils use to protect residential amenity is a specific noise condition—often stipulating that the noise from mechanical plant (like AC and refrigeration units) must not exceed the existing background noise level by more than a set amount, typically 5 decibels (5 dB).

Here is why this specific condition is so critical, especially in a warming world:

  • It Relies on Context, Not Just Volume: Background noise drops significantly at night when traffic dies down and people go to sleep. A cooling unit that blends into the daytime hum of a city can sound like a jet engine at 11 PM. By tying the noise limit to the background level rather than a fixed number, the condition ensures that the acoustic character of the neighborhood is protected during its quietest, most vulnerable hours.

  • The “Noticeability” Threshold: In acoustics, an increase of 5 dB is generally the point where a new noise becomes clearly noticeable and potentially intrusive to the human ear. If AC units were allowed to operate unchecked without this cap, creeping noise pollution would slowly erode the quality of life for nearby residents, leading to stress, sleep deprivation, and a loss of enjoyment of their own homes.

  • A Measurable Line in the Sand: As climate change forces older AC systems to work harder and run later into the night, facilities can easily stray from their original operating parameters. The 5 dB limit provides an objective, measurable threshold. When residents complain that the noise has “gotten worse,” acoustic consultants can place a monitor in their garden, capture the real-time data, and definitively prove whether the facility is breaching its legal planning limits.

Ultimately, this standard prevents facilities from passing the environmental cost of their cooling needs onto their neighbors. As our summers get hotter, enforcing these strict background-relative limits will be our best defense against the creeping roar of urban infrastructure.

If you have a problem with Noise from Air Conditioning Units then Please contact us.

Lighting Assessment – Plymouth, Devon

Eco-Friendly Illumination: Managing Light Spill in Plymouth

Sensory pollution is becoming a major focus for local councils across the UK. In Plymouth, Devon, a specialized Light Pollution Assessment was recently completed for a seasonal observation wheel attraction located within a prominent public park. This strategy successfully supports the discharge of local environmental planning conditions by balancing public safety with wildlife protection.

Lighting Assessment For Ferris Wheel – 3D Model Shot

Balancing Public Spaces and Active Habitats

The public park is a well-loved community asset that hosts annual events, but it is also bordered by mature trees that serve as vital commuting and foraging routes for nocturnal wildlife, such as bats and insects. Designing a lighting layout for a large, decorative attraction requires minimizing glare and preventing sky glow.

Plymouth Barbican

The Approved Light Mitigation Strategy

To protect the local ecosystem, the technical design incorporates several strict, wildlife-conscious principles:

  • Warm Spectrum LEDs: All external lighting will feature a warm white (2200K) color temperature. This specific spectrum is drastically less disruptive to nocturnal invertebrates and bats compared to standard cool-blue lights.

  • Zero Upward Spill: All fixtures on the wheel are precisely aligned horizontally or downward. No direct vertical beams or spotlights will be used, keeping the night sky clear.

  • Strict Operational Curfews: To ensure local habitats return to natural darkness overnight, all decorative lighting will operate under a strict curfew and be manually turned off by operators at 21:00.

This targeted lighting design ensures that visitors can enjoy a safe, memorable experience while the park’s nocturnal residents remain entirely undisturbed.

Preliminary Ecological Appraisal (PEA) – Bridport, Dorset

Balancing Development and Biodiversity in Dorset

Designing with Nature: A Success Story Near Bridport

When planning any new development, understanding the local ecology is the first step toward a successful build. A Preliminary Ecological Appraisal (PEA) was conducted for a proposed farmworker’s dwelling and parking area near Bridport, Dorset. The assessment highlights how tailored mitigation measures can keep a project moving forward while fully respecting the surrounding landscape.

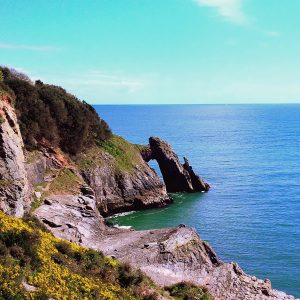
Bridport Town Centre (Stock Image)

Understanding the Landscape Baseline

The development footprint itself sits on managed modified grassland and a small patch of mixed scrub, which holds low nature conservation value at a local level. However, because the site is nestled within the beautiful Dorset National Landscape and falls inside the Impact Risk Zones for two nearby Sites of Special Scientific Interest (SSSIs), the wider environmental context required careful navigation.

Key Ecological Findings & Solutions

While the on-site survey revealed that the immediate plot has low ecological sensitivity, an old stone agricultural building directly adjacent to the boundary presents unique factors:

  • Protecting Nocturnal Wildlife: The neighboring building contains features suitable for roosting bats. To prevent domestic light spill from disrupting these nocturnal animals and to comply with local Dark Skies policies, a Phase 2 Lighting Assessment has been integrated into the next steps of the design process.

  • Safeguarding Nesting Birds: Active swallow nests were confirmed nearby, and the boundary vegetation offers excellent habitat for common breeding birds. To remain fully compliant with wildlife legislation, high-impact construction works and vegetation clearance will be strictly scheduled outside the peak nesting season (March to September).

Building a Greener Future

Beyond protecting what is already there, the project presents an excellent opportunity to deliver active biodiversity gains. Final development plans will incorporate pollinator-friendly landscaping, bat boxes, and bird boxes to ensure the new home gives back to the local ecosystem.

Radon Testing – Digital Monitors vs 3 Month Passive Kits

Radon Testing –  Digital Monitors vs. 3 Month Passive Kits

As an environmental geologist, a recent conversation I had with a client revolved around radon testing equipment. We often see a clash between the instant data provided by consumer digital monitors (like the AEG HOUND-3699) and the traditional three-month passive alpha-track detectors supplied by UKHSA Harwell labs (pictured below).

Clients watch their digital screens spike and plummet, prompting understandable anxiety. They wonder why official bodies are seemingly dismissive of this short-term data. The answer lies in understanding what these different devices are actually measuring and how radon behaves in the real world.

Chronic Exposure vs. Acute Risk

The first hurdle is reframing how we view the numbers on a digital monitor. When a red light flashes on a sensor, our instinct is to treat it like a carbon monoxide alarm—an acute, immediate threat requiring rapid evacuation.

Radon does not present an acute risk. It is a chemically inert noble gas that poses a chronic health risk. The hazard arises from cumulative exposure over years and decades, which increases the statistical probability of lung tissue damage. A sudden spike in radon over a weekend during a storm front does not constitute an immediate radiological emergency. The goal of monitoring is to assess long-term, chronic exposure levels rather than isolated atmospheric events.

Why the Numbers “Shoot Around”

Homeowners watching a digital monitor often ask how the device can be useful if the readings fluctuate so wildly. The reality is that the monitor is simply reflecting the dynamic nature of soil gas.

Radon concentrations indoors are heavily influenced by a phenomenon known as barometric pumping:

  • High-Pressure Systems: When high atmospheric pressure sits over an area, it acts like a cap, restricting the upward migration of radon and keeping it within the soil pore spaces beneath the building.
  • Low-Pressure Systems: When an abrupt low-pressure front moves in, that atmospheric weight lifts. The pressure inside the soil becomes relatively higher than the air above, and the trapped, concentrated radon rapidly vents upward.

Combined with the internal “stack effect” of a house (warm air rising and pulling air from the foundation), these weather changes create massive, real-time spikes. A three-month Harwell kit smooths out 90 days of this natural chaos into a single, reliable average. A digital monitor simply exposes the daily fluctuations.

The Value of Short-Term Data Sufficiency

Official health and radiation bodies rely on the three-month test because it is the minimum duration required to capture sufficient seasonal variation—accounting for both summer ventilation and winter heating—to estimate an annual average. They generally will not engage with a two-week dataset for formal compliance.

However, in environmental geology, short-term screening holds distinct value for identifying data sufficiency. While a short-term test cannot definitively categorize a building as low risk, it can strongly indicate when mitigation is likely necessary, potentially saving months of waiting.

Indicators that a short-term two-week test might present sufficient data to plan mitigation include:

  • Elevated Valleys: If the lowest points of the natural cycle (the “valleys” on a data graph) consistently remain above the 200 Bq/m³ Action Level, it is highly improbable that the long-term average will fall into a low-risk category.
  • High Short-Term Averages: A sustained two-week average in the region of 400 to 600 Bq/m³, particularly during warmer months when the baseline is typically lower, suggests a substantial underlying geological issue. In these scenarios, the anticipated winter peaks would likely push the annual average well beyond recommended thresholds.

The “Open Window” Dilemma

A common scenario involves residents who prefer to sleep with their windows open year-round. They logically assume a short-term test should be conducted with the window open to reflect their actual breathing conditions.

For a short-term digital screening (typically 7 to 14 days), maintaining “Closed Building Conditions” is essential. The purpose of this abbreviated test is to assess the building’s underlying potential to draw in soil gas, temporarily isolating it from weather and occupant variables.

Testing with an open window during a mild week can artificially suppress the readings, creating a misleading low-risk profile. This masks the “winter trap”—the inevitable period when temperatures drop, windows close, and the central heating amplifies the stack effect, potentially drawing significant radon levels indoors.

If a resident is uncomfortable maintaining closed windows for two weeks, short-term screening may not be viable. In such cases, the appropriate path is the traditional three-month passive test, which explicitly accounts for normal living conditions over a longer timeline.

Finding the Balance

Digital monitors and passive lab kits serve different diagnostic purposes. A brief digital screening is an investigative tool that provides insight into how a building interacts with the ground beneath it. The three-month lab test remains the standard for evaluating long-term, chronic exposure and determining overall risk. Using them appropriately ensures we gather the right data for the right situation.

How we Can Help

Step 1: Scheme Design

  • Regulatory Compliance: Draft the mitigation design to align strictly with UK Building Regulations Approved Document C and BRE Report BR 211 (Radon: Guidance on protective measures for new buildings).
  • System Selection: Specify either passive barrier protection or active sub-floor depressurization (radon sumps/Positive Input Ventilation) tailored to the building’s specific footprint to target a long-term minimum risk level.
  • Detailing Specifications: Author a clear method statement for the contractor, emphasizing gas-tight sealing specifications around service penetrations, corners, and floor-to-wall joints.

Step 2: Supervised Installation

  • Contractor Briefing: Instruct the general builder on the distinction between standard damp-proof membranes (DPMs) and gas membranes, highlighting that radon protection requires absolute continuity.
  • Critical Phase Inspections: Conduct mandatory on-site inspections at key construction milestones:
  • Prior to pouring concrete to verify membrane continuity, lap welds, and puncture-free surfaces.
  • Prior to backfilling to inspect sump placement and pipework connections.
  • Active QA: Identify and oversee the immediate remediation of any installation defects or punctures caused by secondary trades.

Step 3: Building Control Sign-Off

  • Verification Dossier: Compile a comprehensive Quality Assurance package for the Local Authority or Approved Inspector.
  • Evidence Portfolio: Include your original design specifications, material datasheets, and a clear photographic log detailing every critical sealed penetration and joint.
  • Professional Sign-Off Letter: Issue a formal verification statement under your professional credentials confirming the system was installed under supervision and complies fully with the design.

Step 4: Post-Mitigation Efficacy Testing

  • Initial Rapid Screening: Deploy a digital monitor for a 14-day period under closed conditions immediately after construction to get initial confirmation that the system is operating as intended.
  • Compliance Baseline: Follow the rapid screening with an official 3-month UKHSA passive detector test under normal living conditions. This provides the legally recognized, seasonally adjusted data needed to verify that chronic exposure has been managed down to a minimum risk level for the building’s permanent records.

Great Crested Newt District Level Licensing – South Gloucestershire

Great Crested Newt District Level Licensing – South Gloucestershire

Building your own home is an exciting milestone, but the planning process can sometimes unearth unexpected challenges, especially when local wildlife is involved. We recently had the pleasure of supporting a client with their application to erect a single self-build dwelling. The project, beautifully situated in the South West, is a perfect example of how early ecological consultation can keep your development on track.

The Challenge: Nearby Habitats

When embarking on a new build, assessing the surrounding environment is a critical first step. While there were no waterbodies directly within our client’s site boundary , our assessments identified three ponds within a 250-metre radius. Because the Great Crested Newt (GCN) is a European protected species , strict regulations apply to developments that could disturb them or damage their resting places. Even if the newts aren’t directly on your footprint, nearby ponds often mean you need an official strategy to proceed.

Great Crested Newt – Rainer Theuer

The Solution: District Level Licensing (DLL)

To ensure the project could move forward without delays, we acted as the lead ecological consultants to manage the Great Crested Newt District Level Licensing (DLL) process. District Level Licensing is a fantastic route operated by Natural England that often provides a quicker, more streamlined alternative to traditional mitigation licenses. Here is how we delivered for our client:

First, we managed the necessary ecological assessments, including eDNA surveys to accurately determine the presence or absence of GCNs in the area. Second, we handled the complex DLL enquiry process from start to finish, meticulously compiling site data and mapping the required GIS polygon shapefiles. Finally, by acting as the primary agent, we ensured all documentation was fully complete and accurate, aligning the proposed construction timescales with the licensing requirements.

Keeping Your Project Moving

Because we handled the technical intricacies of the wildlife legislation, our client was able to submit their planning consent with the confidence that the licensing requirements were fully under control.

Do you need help with a GCN DLL Enquiry?

Whether you are planning a small private development or a large-scale project, navigating protected species legislation doesn’t have to be a roadblock. Our team of expert ecologists is here to guide you through the District Level Licensing process quickly and efficiently. Contact us today to discuss your site and find out how we can help you achieve your development goals while supporting local biodiversity.

District Level Licensing for Newts 

Ecological Drone Survey Services: Applications of RGB Photogrammetry

Drone Surveys for Ecological Purposes

Through the application of photogrammetry and post-processing software, this standard imagery can be converted into measurable, actionable data for ecological assessment.

Below is an overview of the ecological drone survey services we offer, utilizing RGB cameras and advanced data interpretation techniques.

Drone Data Collection Planning

Habitat Mapping and Land Cover Classification Surveys

Our habitat mapping surveys generate high-resolution orthomosaics—distortion-free maps created by stitching together overlapping aerial photographs. These outputs provide a precise top-down view of the survey area.

  • Micro-Habitat Delineation: We map distinct vegetation zones, wetland boundaries, and transition areas (ecotones) at a centimeter-level resolution, providing greater detail than standard satellite imagery.

  • Invasive Species Identification: High-resolution RGB imagery allows for the visual identification and mapping of specific invasive plant species based on their distinct coloration or flowering periods.

  • Habitat Fragmentation Analysis: The data allows for the measurement of distances between habitat patches, the length of edge habitats, and the assessment of wildlife corridor connectivity.

3D Topographical and Structural Surveys

Using Structure from Motion (SfM) software, we process 2D images to construct accurate 3D models of the ecosystem, allowing for the analysis of physical vegetation structure and ground topography.

  • Canopy Height Models (CHM): By generating a Digital Surface Model (DSM, representing the top of the vegetation canopy) and a Digital Terrain Model (DTM, representing the bare ground), we can calculate the specific height of forest or scrub canopies.

  • Biomass and Carbon Estimation: Structural metrics derived from our 3D models can be correlated with ground-truthed data to support the estimation of above-ground biomass and carbon storage.

  • Hydrology and Geomorphology Mapping: DTMs allow for the modeling of surface water flow, the identification of pooling areas in wetland ecosystems, and the measurement of coastal or riverbank erosion over time.

Vegetation Health Assessments (RGB Indices)

While Near-Infrared sensors are standard for certain health metrics, vegetation vigor can still be estimated using purely RGB data through mathematical manipulation of the red, green, and blue pixels.

RGB Data Interpretation

  • Visible Atmospherically Resistant Index (VARI): We utilize VARI to assess canopy cover and relative plant health. This index measures the greenness of an area while minimizing atmospheric effects.

  • Phenology Monitoring: Through repeated surveys, we can map seasonal changes such as spring leaf-out or autumn senescence, providing data on phenological shifts and climatic impacts on local vegetation.

Wildlife Population Surveys

Standard RGB drone imagery is an effective method for direct population counts, particularly in areas that are difficult to access on foot.

  • Colony Counting: We conduct high-altitude orthomosaic surveys to capture nesting bird colonies or resting marine mammal populations. This method minimizes the disturbance associated with ground surveys or low-flying crewed aircraft.

  • Automated Detection: Orthomosaic outputs can be integrated with AI and Machine Learning models to facilitate the automated detection and counting of specific animal species across large survey areas.

Habitat Condition Survey

Temporal Change Detection and Monitoring

We offer repeatable survey programs to monitor changes in a specific landscape over time.

  • Restoration Monitoring: For sites undergoing rewilding, peatland restoration, or afforestation, we conduct automated grid flights at regular intervals (e.g., bi-annually). By analyzing the resulting orthomosaics and 3D models chronologically, we provide quantifiable data on landscape recovery and structural changes.