Drone Surveys in the Environmental Consultancy Sector
In the commercial sector, consultancies rely heavily on accurate topographical models and 3D visualizations to conduct Landscape and Visual Impact Assessments (LVIA)—such as modeling the visual footprint of proposed wind turbines—or to establish accurate site baselines for Preliminary Ecological Assessments.
The processing was conducted entirely on open-source Linux software. The hardware utilized was a Lubuntu workstation equipped with an Intel Core i9, an NVMe SSD, and 16GB of RAM. While the processor and storage speeds were more than adequate, the 16GB memory capacity required some careful resource management during the heavier processing phases.
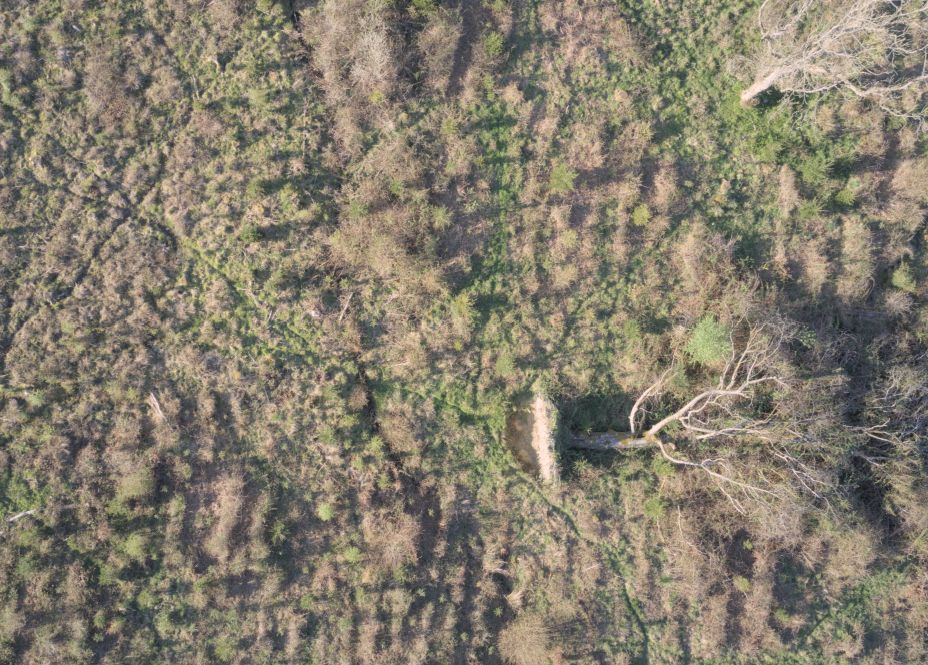
44 images like this one used to create mesh (the fallen tree is a good reference point)
Phase 1: Flight Planning and Data Acquisition
A 2D flight grid was plotted using a web-based mission planner (Drone Grid), and the resulting CSV was imported into Litchi to run on the drone controller.
Rather than relying on automated distance-based photo triggers—which can occasionally misfire or skip photos during curved maneuvers—a manual interval approach was utilized (Litchi). The drone was placed in a hover, the camera was set to a 2-second interval, and the shutter was manually engaged before initiating the mission. This ensured a continuous, reliable stream of overlapping images as the drone navigated the grid.
Phase 2: Dataset Culling and Format Conversion
Once the flight was completed, a quality control check was performed on the dataset. Any extraneous photos captured during takeoff, landing, or non-nadir (not pointing straight down) turns were removed, as these irregular angles can confuse the photogrammetry software and corrupt the final geometry.
Initially, the drone was set to capture RAW (.DNG) files. While RAW formats are excellent for standard photography, they lack the automated lens-flattening corrections applied to DJI’s JPEGs. Furthermore, uncompressed RAW files are heavily taxing on system memory during 3D processing.
To rectify this, the DNGs were imported into darktable on Linux. A batch lens correction profile was applied to eliminate the fish-eye distortion, and the dataset was exported as high-quality JPEGs. (Note: moving forward, capturing JPEGs natively on the drone is highly recommended to bypass this conversion step entirely).
Phase 3: Processing in WebODM
WebODM (OpenDroneMap), deployed via Docker, was used for the photogrammetry processing.
The 3D texturing phase of photogrammetry is notoriously memory-intensive, and the 16GB of system RAM was quickly identified as a bottleneck. To prevent Docker from running out of memory and crashing the process, the Resize Images parameter within WebODM’s settings was capped at 2048. This significantly reduced the memory footprint during the dense point cloud and meshing phases, allowing the i9 processor to complete the job smoothly while leveraging the fast swap/read speeds of the NVMe drive.
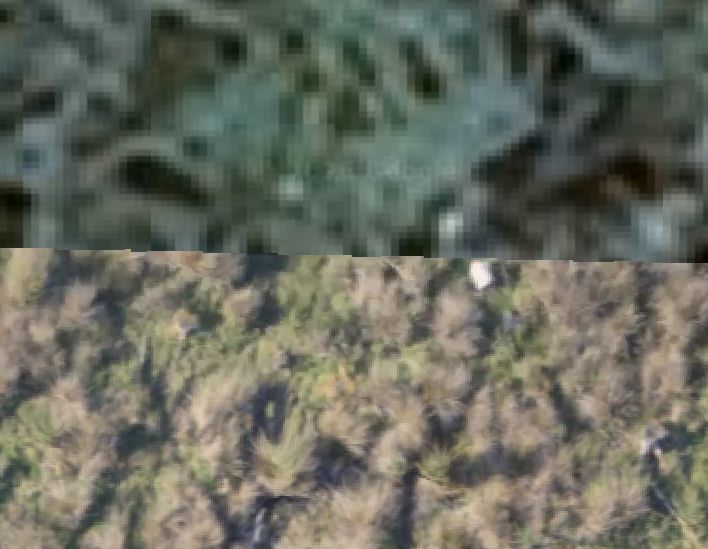
Top Google Satellite Image / Bottom Ortho Mesh Photo Output from WebOMD
Phase 4: Output Visualization
Once the processing concluded, the 2D orthomosaic was reviewed directly within the WebODM web interface. The software successfully stitched the dataset into a crisp, seamless top-down map, providing an excellent baseline of the site.
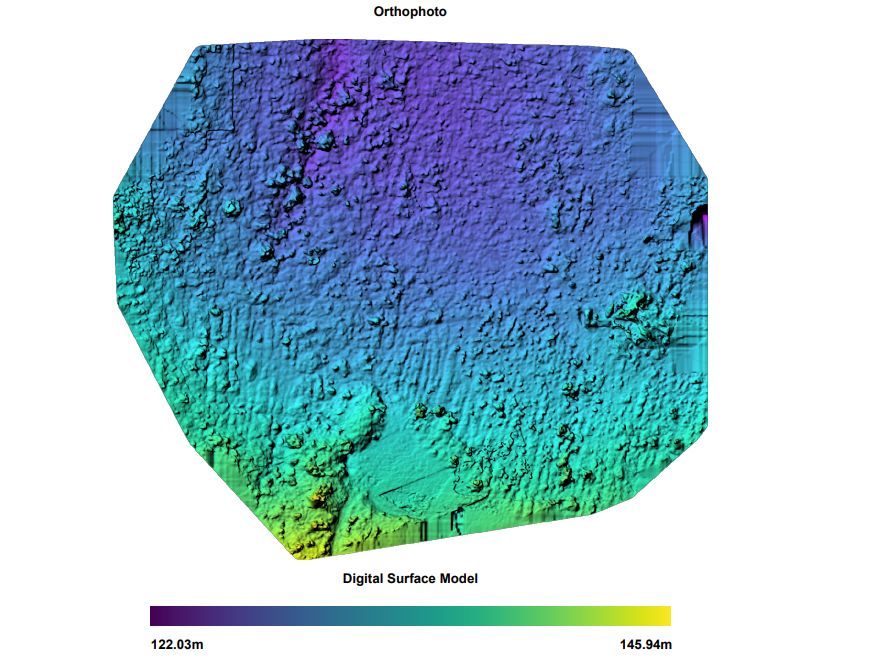
DSM From Drone Data
Viewing the 3D output required a slight workaround. Rendering a massive, fully-textured 3D mesh directly in the browser via WebGL can sometimes cause instability depending on Linux graphics drivers. Instead, the .obj file and its associated texture map were downloaded and opened natively in Blender.
Because 3D software often disagrees on coordinate systems, the mesh imported on its side. This was quickly corrected by rotating the model 90 degrees on the X-axis. Once the material preview was enabled, the high-resolution texture map was projected onto the geometry, yielding a mathematically accurate, true-to-life 3D representation of the area.
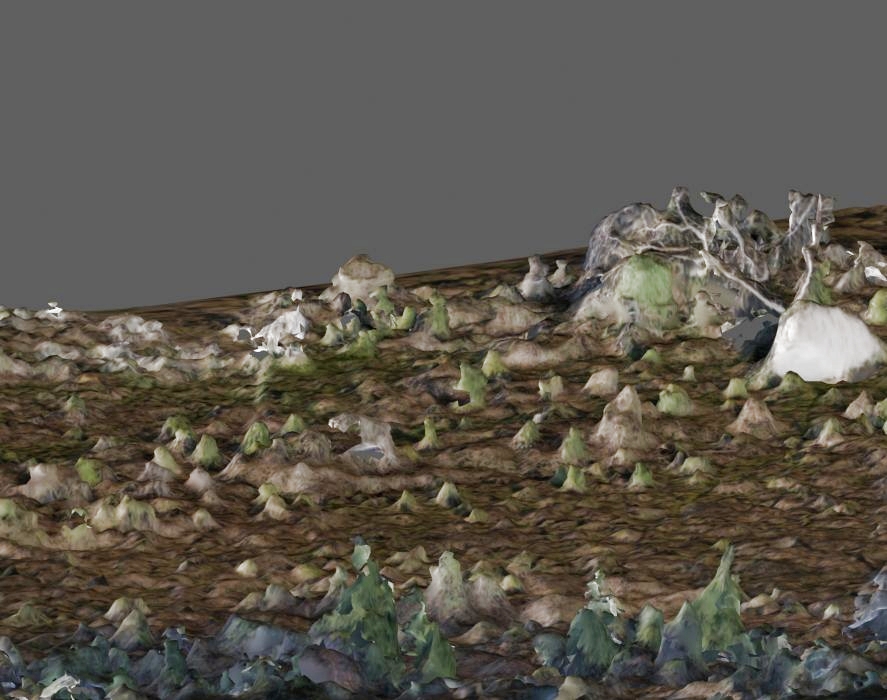
3D Mesh Image (Note the white shape to the top right is root ball of fallen tree)
Conclusion
By effectively managing hardware limits and ensuring the dataset is properly formatted, commercial-tier photogrammetry can be reliably executed on a standard Linux workstation. The resulting 2D and 3D outputs now serve as a foundational geospatial baseline.